937
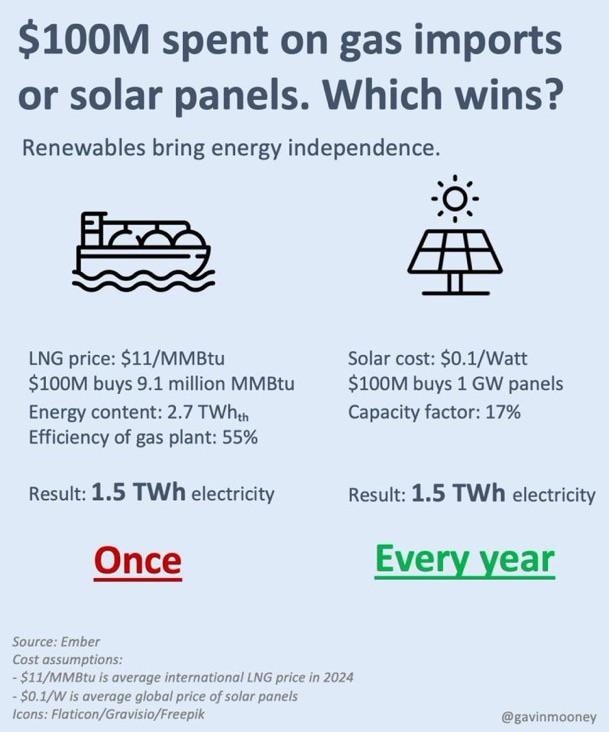
Gas imports or solar panels?
(slrpnk.net)
Discussion of climate, how it is changing, activism around that, the politics, and the energy systems change we need in order to stabilize things.
As a starting point, the burning of fossil fuels, and to a lesser extent deforestation and release of methane are responsible for the warming in recent decades:

How much each change to the atmosphere has warmed the world:

Recommended actions to cut greenhouse gas emissions in the near future:

Anti-science, inactivism, and unsupported conspiracy theories are not ok here.
Not a fair comparison.
In a nutshell, you can't directly replace gas power with electric power. Gotta have some sort of conversion. Gas is very portable and offers big bang. Solar generally needs to be generated on demand or stored. Then it needs to be transported. We can't transport the solar power from Texas to Michigan the same way we can truck gas across state lines. The longer an electric line, the more power is lost.
Another issue with this graphic is that it implies that solar panels are a one-time expense. This isn't true. They generally last about 20 years.
I'm a champion of green energy, but a stickler for details.
Then as a stickler you should probably clarify that 20yrs isn’t the lifespan of a panel but the simply the end of most warranty periods.
The panel itself is (typically) fine, just less efficient after so long.