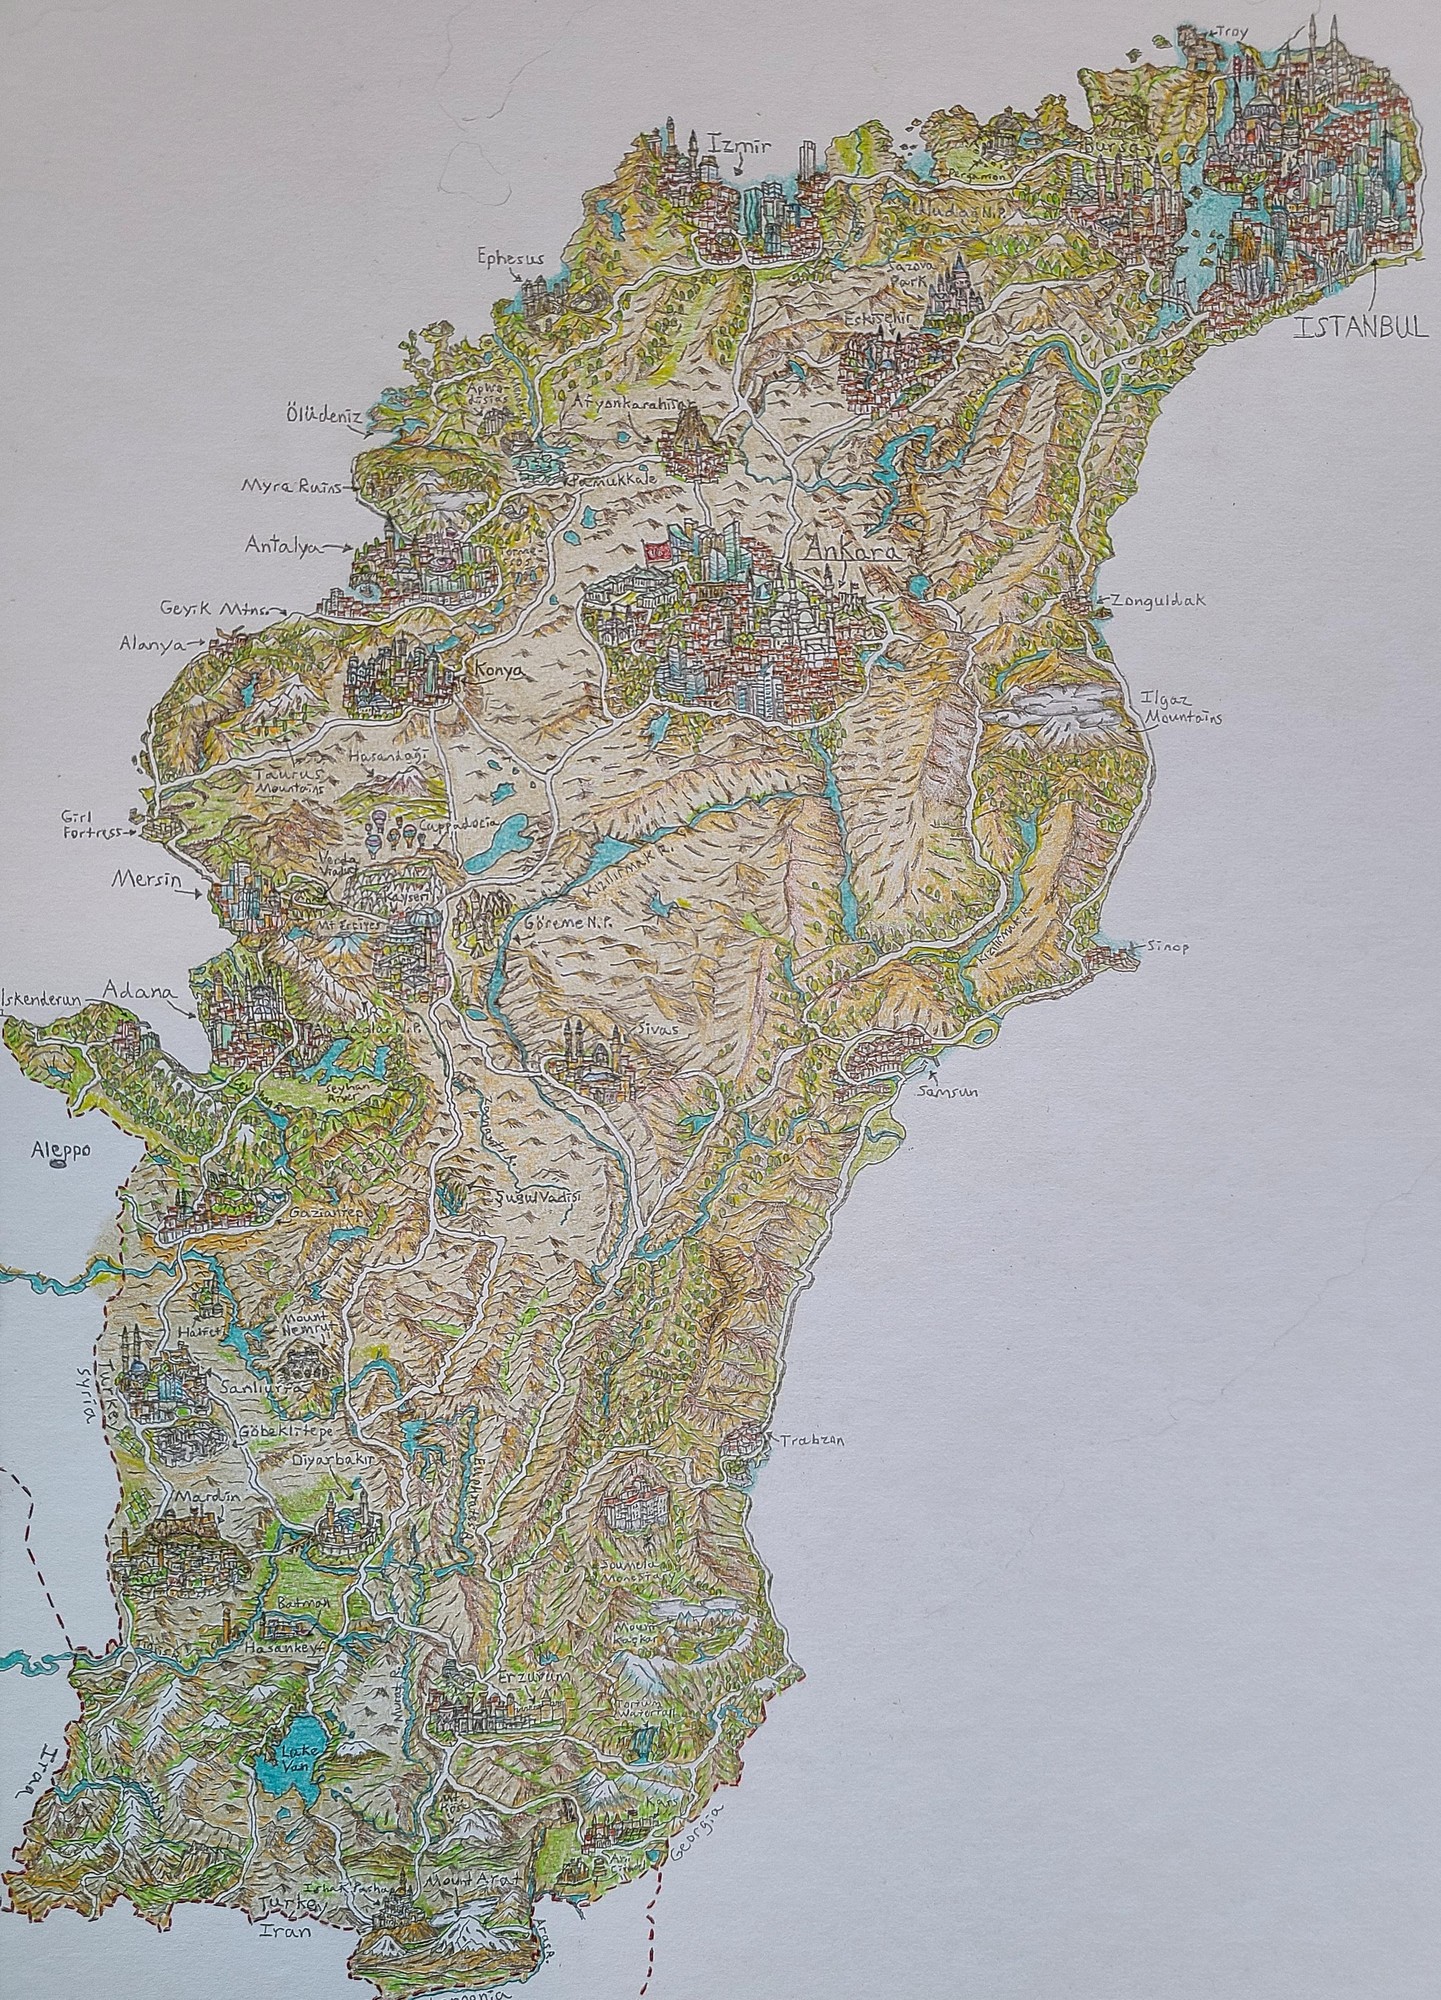
1
40
Map of State Foods (lemmy.world)
2
32
3
119
US Housing Affordability (substackcdn.com)
submitted 6 days ago* (last edited 6 days ago) by Davriellelouna@lemmy.world to c/map_enthusiasts@sopuli.xyz
4
51
5
133

cross-posted from: https://lemmy.ca/post/46809135

The stop killing games campaign is about preventing game publishers from intentionally destroying their games after official support ends.

Sign here:

https://eci.ec.europa.eu/045/public/#/screen/home

6
485
7
54
8
20
9
42
Father's Day in Europe (64.media.tumblr.com)

cross-posted from: https://piefed.zip/post/92262

10
118
11
19
Leo Belgicus (en.wikipedia.org)

The Leo Belgicus (Latin, 'Belgic Lion') was used in both heraldry and map design to symbolize the former Low Countries (current day Netherlands, Luxembourg, Belgium and a small part of northern France) with the shape of a lion.

2,810 × 4,000 pixels:
https://upload.wikimedia.org/wikipedia/commons/b/b5/Leo_Belgicus_%28Dutch-Belgic_Lion_of_the_Low_Countries%29_Famiano_Strada_c1647.jpg

12
11

Academic study on the use of the octopus metaphor to represent grasping, controlling invasive entities etc. Examines many examples.

Serio-comic war map of Europe 1877

Conspiratorial thinking can connect many distinct or distant ills to a central cause. This belief has visual form in the octopus map: a map where a central force (for instance a nation, an ideology, or an ethnicity) is depicted as a literal or figurative octopus, with extending tendrils. In this paper, we explore how octopus maps function as visual arguments through an analysis of historical examples as well as a through a crowd-sourced study on how the underlying data and the use of visual metaphors contribute to specific negative or conspiratorial interpretations. We find that many features of the data or visual style can lead to “octopus-like” thinking in visualizations, even without the use of an explicit octopus motif. We conclude with a call for a deeper analysis of visual rhetoric, and an acknowledgment of the potential for the design of data visualizations to contribute to harmful or conspiratorial thinking.

Via Metafilter:

13
146
14
44

Source: https://landgeist.com/2022/04/12/spirits-consumption-in-europe/

Other maps on the same topic from the source:

15
416
16
219
17
548
submitted 1 month ago* (last edited 1 month ago) by Irelephant@lemm.ee to c/map_enthusiasts@sopuli.xyz

New Zealand doesn't exist, as usual.

Edit: Swapped image link.

Original link: https://lemm.ee/pictrs/image/9a23037f-23da-44ea-ad39-c7a3147a935c.png

RIP lemm.ee

18
64
19
123
20
219
submitted 1 month ago* (last edited 1 week ago) by kernelle@0d.gs to c/map_enthusiasts@sopuli.xyz

Located in London, I measured the RTT or round trip time to 574,691 random webservers and plotted the times on the globe.

Discovery was done with masscan, measurements using hping and plotting with an old Python script I've revived and enhanced.

~~This is part of the next writeup on my blog, with which I will be posting any of the code I've used.~~

Full write-up and code

Blog / How I made a blog using Lemmy

21
121
22
140
23
87
24
-22
25
600
view more: next ›

Map Enthusiasts

4677 readers
14 users here now

For the map enthused!

Rules:

founded 2 years ago
MODERATORS