60
submitted 3 days ago by otters_raft@lemmy.ca to c/climate@slrpnk.net

An excerpt:

The 22 Arab region countries covered in the WMO’s new State of the Climate report produce about a quarter of the world’s oil, yet directly account for only 5 to 7 percent of global greenhouse gas emissions from their own territories. The climate paradox positions the region as both a linchpin of the global fossil-fuel economy and one of the most vulnerable geographic areas.

WMO Secretary-General Celeste Saulo said extreme heat is pushing communities in the region to their physical limits. Droughts show no sign of letting up in one of the world’s most water-stressed regions, but at the same time, parts of it have been devastated by record rains and flooding, she added.

you are viewing a single comment's thread
view the rest of the comments
[-] Linearity@piefed.zip 1 points 2 days ago* (last edited 2 days ago)

😝
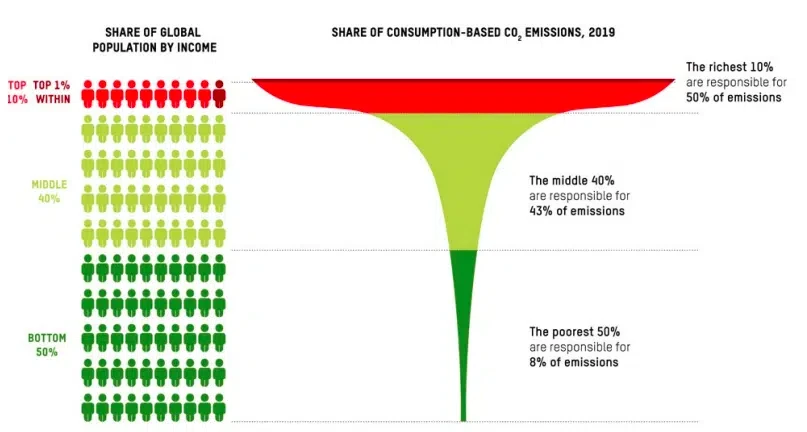
https://earth.org/global-carbon-emissions-richest-1-match-emissions-of-5-billion-people/

Don’t get me wrong, I hate the use of fossil fuel as much as the next guy, but you can’t blame a people for the consequences of everyone’s actions

[-] veganpizza69@lemmy.vg 0 points 1 day ago

Yes and no. How popular do you think ending oil extraction is in those areas? Whatever the percent, that's also a level of consent.

this post was submitted on 06 Dec 2025
60 points (100.0% liked)

Climate - truthful information about climate, related activism and politics.

7666 readers
262 users here now

Discussion of climate, how it is changing, activism around that, the politics, and the energy systems change we need in order to stabilize things.

As a starting point, the burning of fossil fuels, and to a lesser extent deforestation and release of methane are responsible for the warming in recent decades: Graph of temperature as observed with significant warming, and simulated without added greenhouse gases and other anthropogentic changes, which shows no significant warming

How much each change to the atmosphere has warmed the world: IPCC AR6 Figure 2 - Thee bar charts: first chart: how much each gas has warmed the world.  About 1C of total warming.  Second chart:  about 1.5C of total warming from well-mixed greenhouse gases, offset by 0.4C of cooling from aerosols and negligible influence from changes to solar output, volcanoes, and internal variability.  Third chart: about 1.25C of warming from CO2, 0.5C from methane, and a bunch more in small quantities from other gases.  About 0.5C of cooling with large error bars from SO2.

Recommended actions to cut greenhouse gas emissions in the near future:

Anti-science, inactivism, and unsupported conspiracy theories are not ok here.

founded 2 years ago
MODERATORS