31
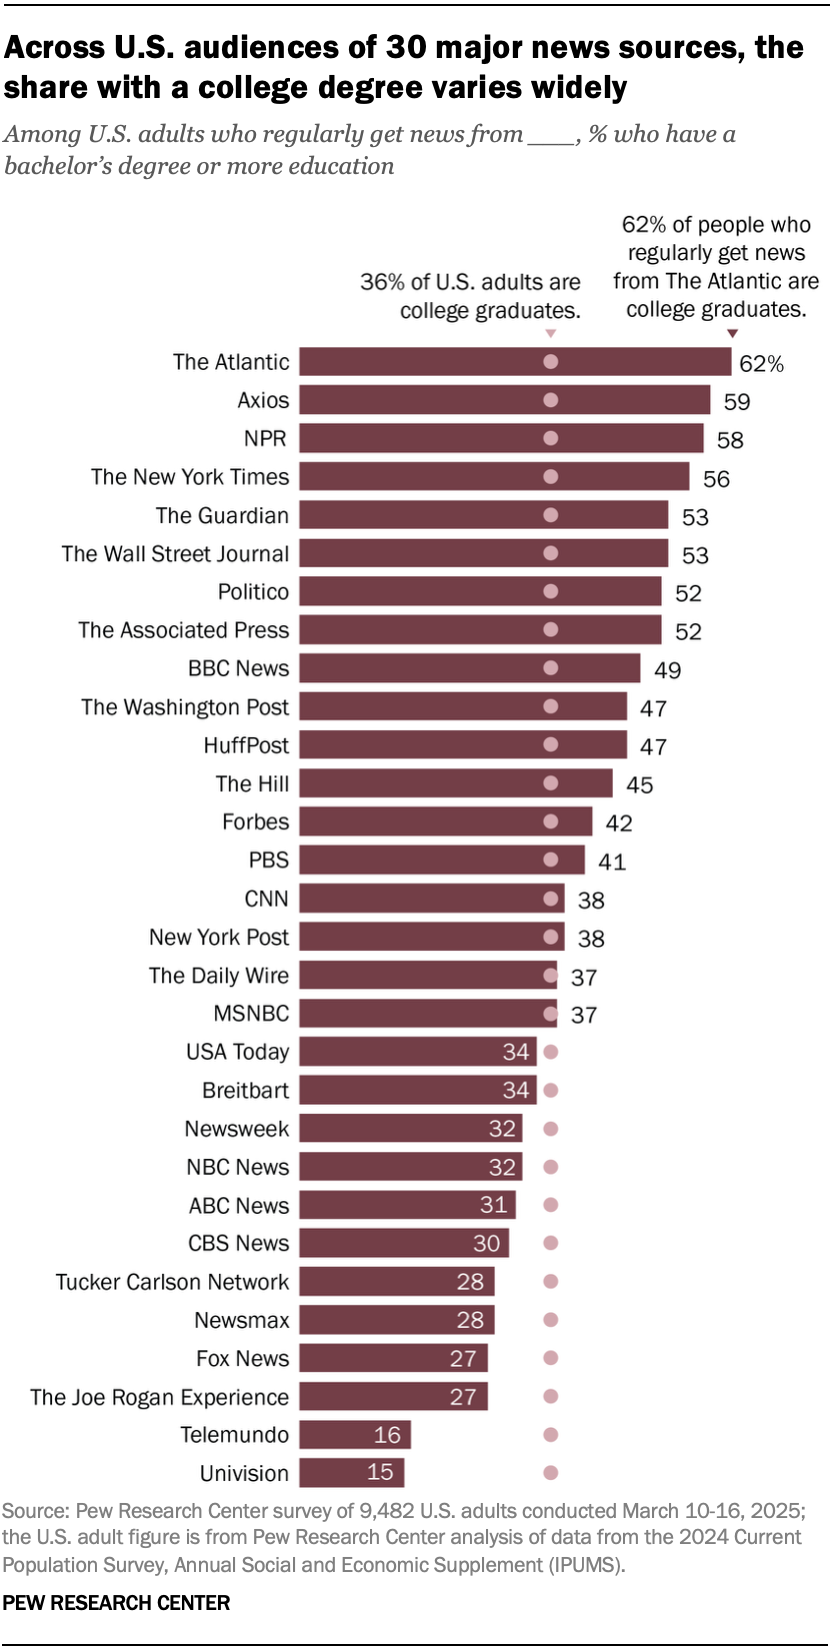
How the audiences of news sources differ in their levels of education
(www.pewresearch.org)
Source: Pew Research Center
Source: Pew Research Center
This is for strictly mildly interesting material. If it's too interesting, it doesn't belong. If it's not interesting, it doesn't belong.
This is obviously an objective criteria, so the mods are always right. Or maybe mildly right? Ahh.. what do we know?
Just post some stuff and don't spam.
Kind of a weird graph....
But they're shown on the same bar graph, which implies they're shown on the same scale. Right? or am I misreading this?