786
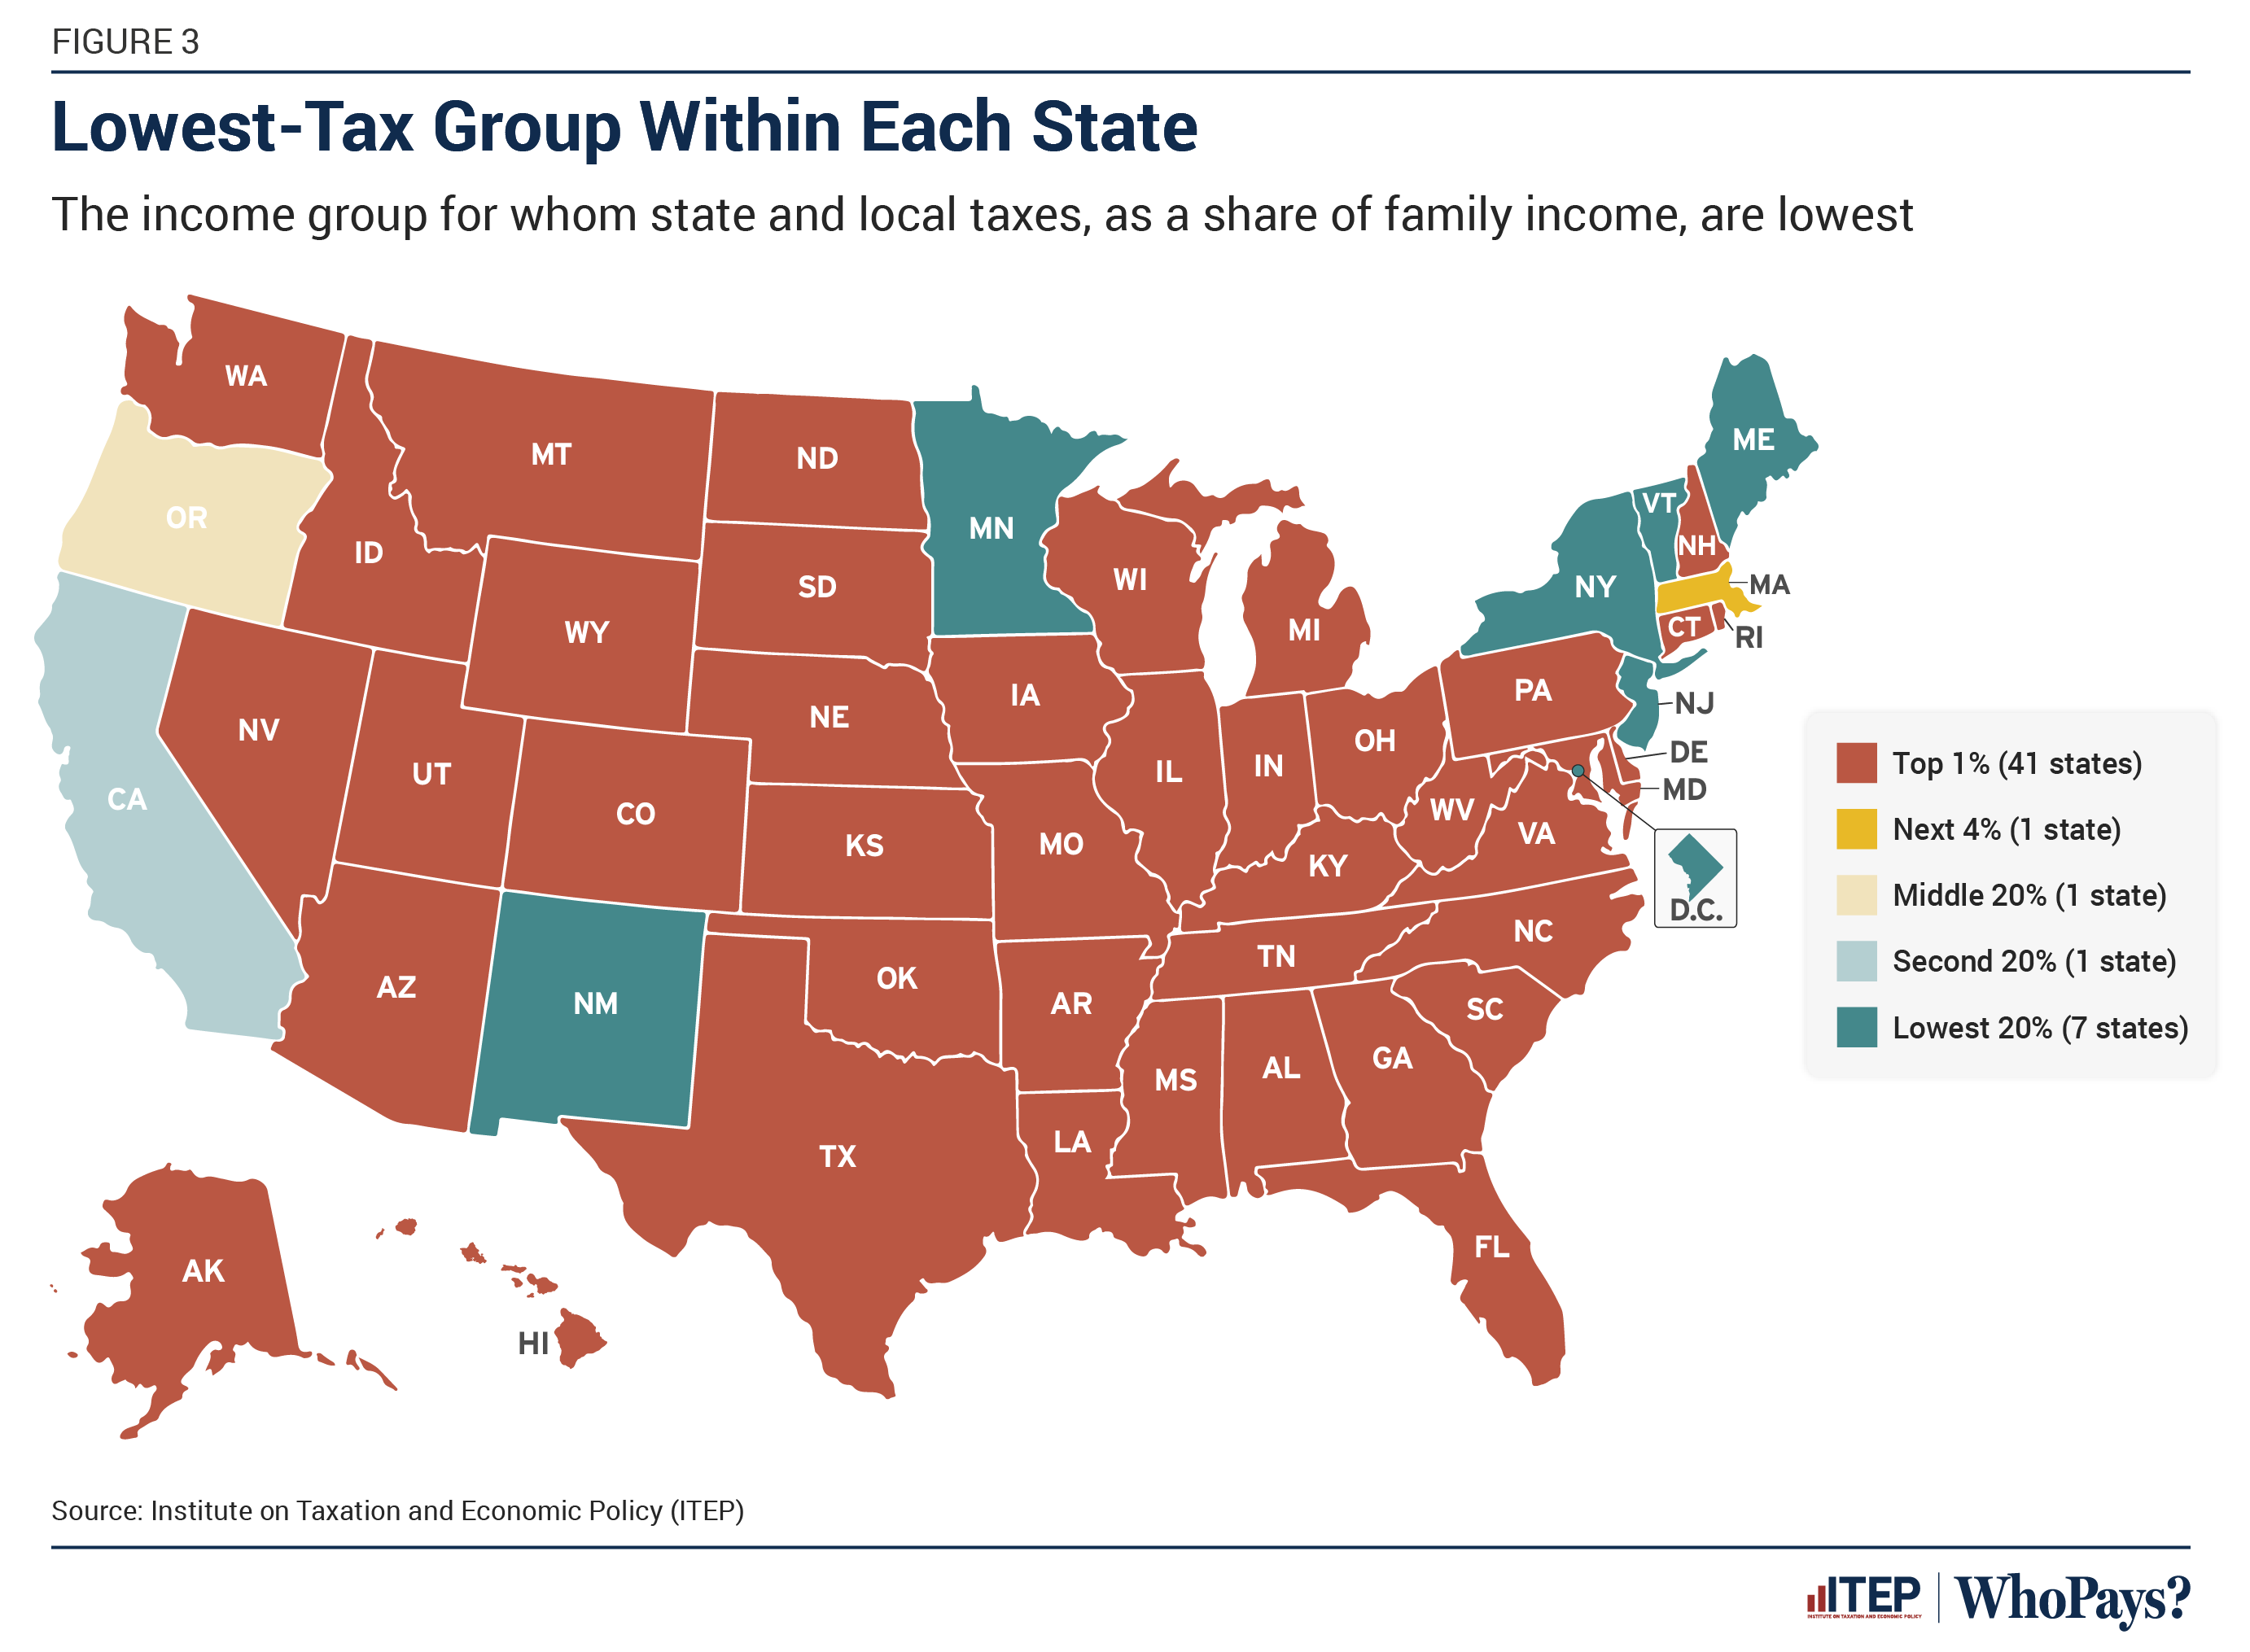
Lowest-taxed group in each state of the United States
(lemmy.world)
A place to share and discuss visual representations of data: Graphs, charts, maps, etc.
DataIsBeautiful is for visualizations that effectively convey information. Aesthetics are an important part of information visualization, but pretty pictures are not the sole aim of this subreddit.
A place to share and discuss visual representations of data: Graphs, charts, maps, etc.
  A post must be (or contain) a qualifying data visualization.

  Directly link to the original source article of the visualization
    Original source article doesn't mean the original source image. Link to the full page of the source article as a link-type submission.
    If you made the visualization yourself, tag it as [OC]

  [OC] posts must state the data source(s) and tool(s) used in the first top-level comment on their submission.

  DO NOT claim "[OC]" for diagrams that are not yours.

  All diagrams must have at least one computer generated element.

  No reposts of popular posts within 1 month.

  Post titles must describe the data plainly without using sensationalized headlines. Clickbait posts will be removed.

  Posts involving American Politics, or contentious topics in American media, are permissible only on Thursdays (ET).

  Posts involving Personal Data are permissible only on Mondays (ET).
Please read through our FAQ if you are new to posting on DataIsBeautiful. Commenting Rules
Don't be intentionally rude, ever.

Comments should be constructive and related to the visual presented. Special attention is given to root-level comments.

Short comments and low effort replies are automatically removed.

Hate Speech and dogwhistling are not tolerated and will result in an immediate ban.

Personal attacks and rabble-rousing will be removed.

Moderators reserve discretion when issuing bans for inappropriate comments. Bans are also subject to you forfeiting all of your comments in this community.
Originally r/DataisBeautiful
By this logic why not just tax high income earners to the point that they make the same as low income earners? After all, they have more money they can part with as you state. Just offering to blindly pay more tax because uncle Sam needs more missiles is a really stupid argument. It leads to gross over spending and negligence. I worked for a government agency for many years and every year they would buy millions of dollars of stuff that never made if off the pallet just because they needed to spend their budget so they got it next year. Not with my money, no thanks.
There's two facets to consider. -Is government spending well managed, and if not, what to do to improve it? You may have some fair points there
-To the extent government spending is reasonably required, how to handle paying for it? On this, you overextend their point about who can afford. Someone making $30k/year and trying to get by can't really spare any money. Someone making $500k/year would still have crap tons of money even paying $200k/year in taxes. No one is proposing that making more should make it so you take home less than the low income person, or even close to the low income person, just that the proportion that can go to government comfortably increases.
I don't disagree with you there. I made that very same point. And that's the answer to your question, as well as part of your previous statement. We're still mostly a capitalist society, so you get to reap the rewards of your income. But we have socialist programs too, so those who can bear more of the weight do so.