786
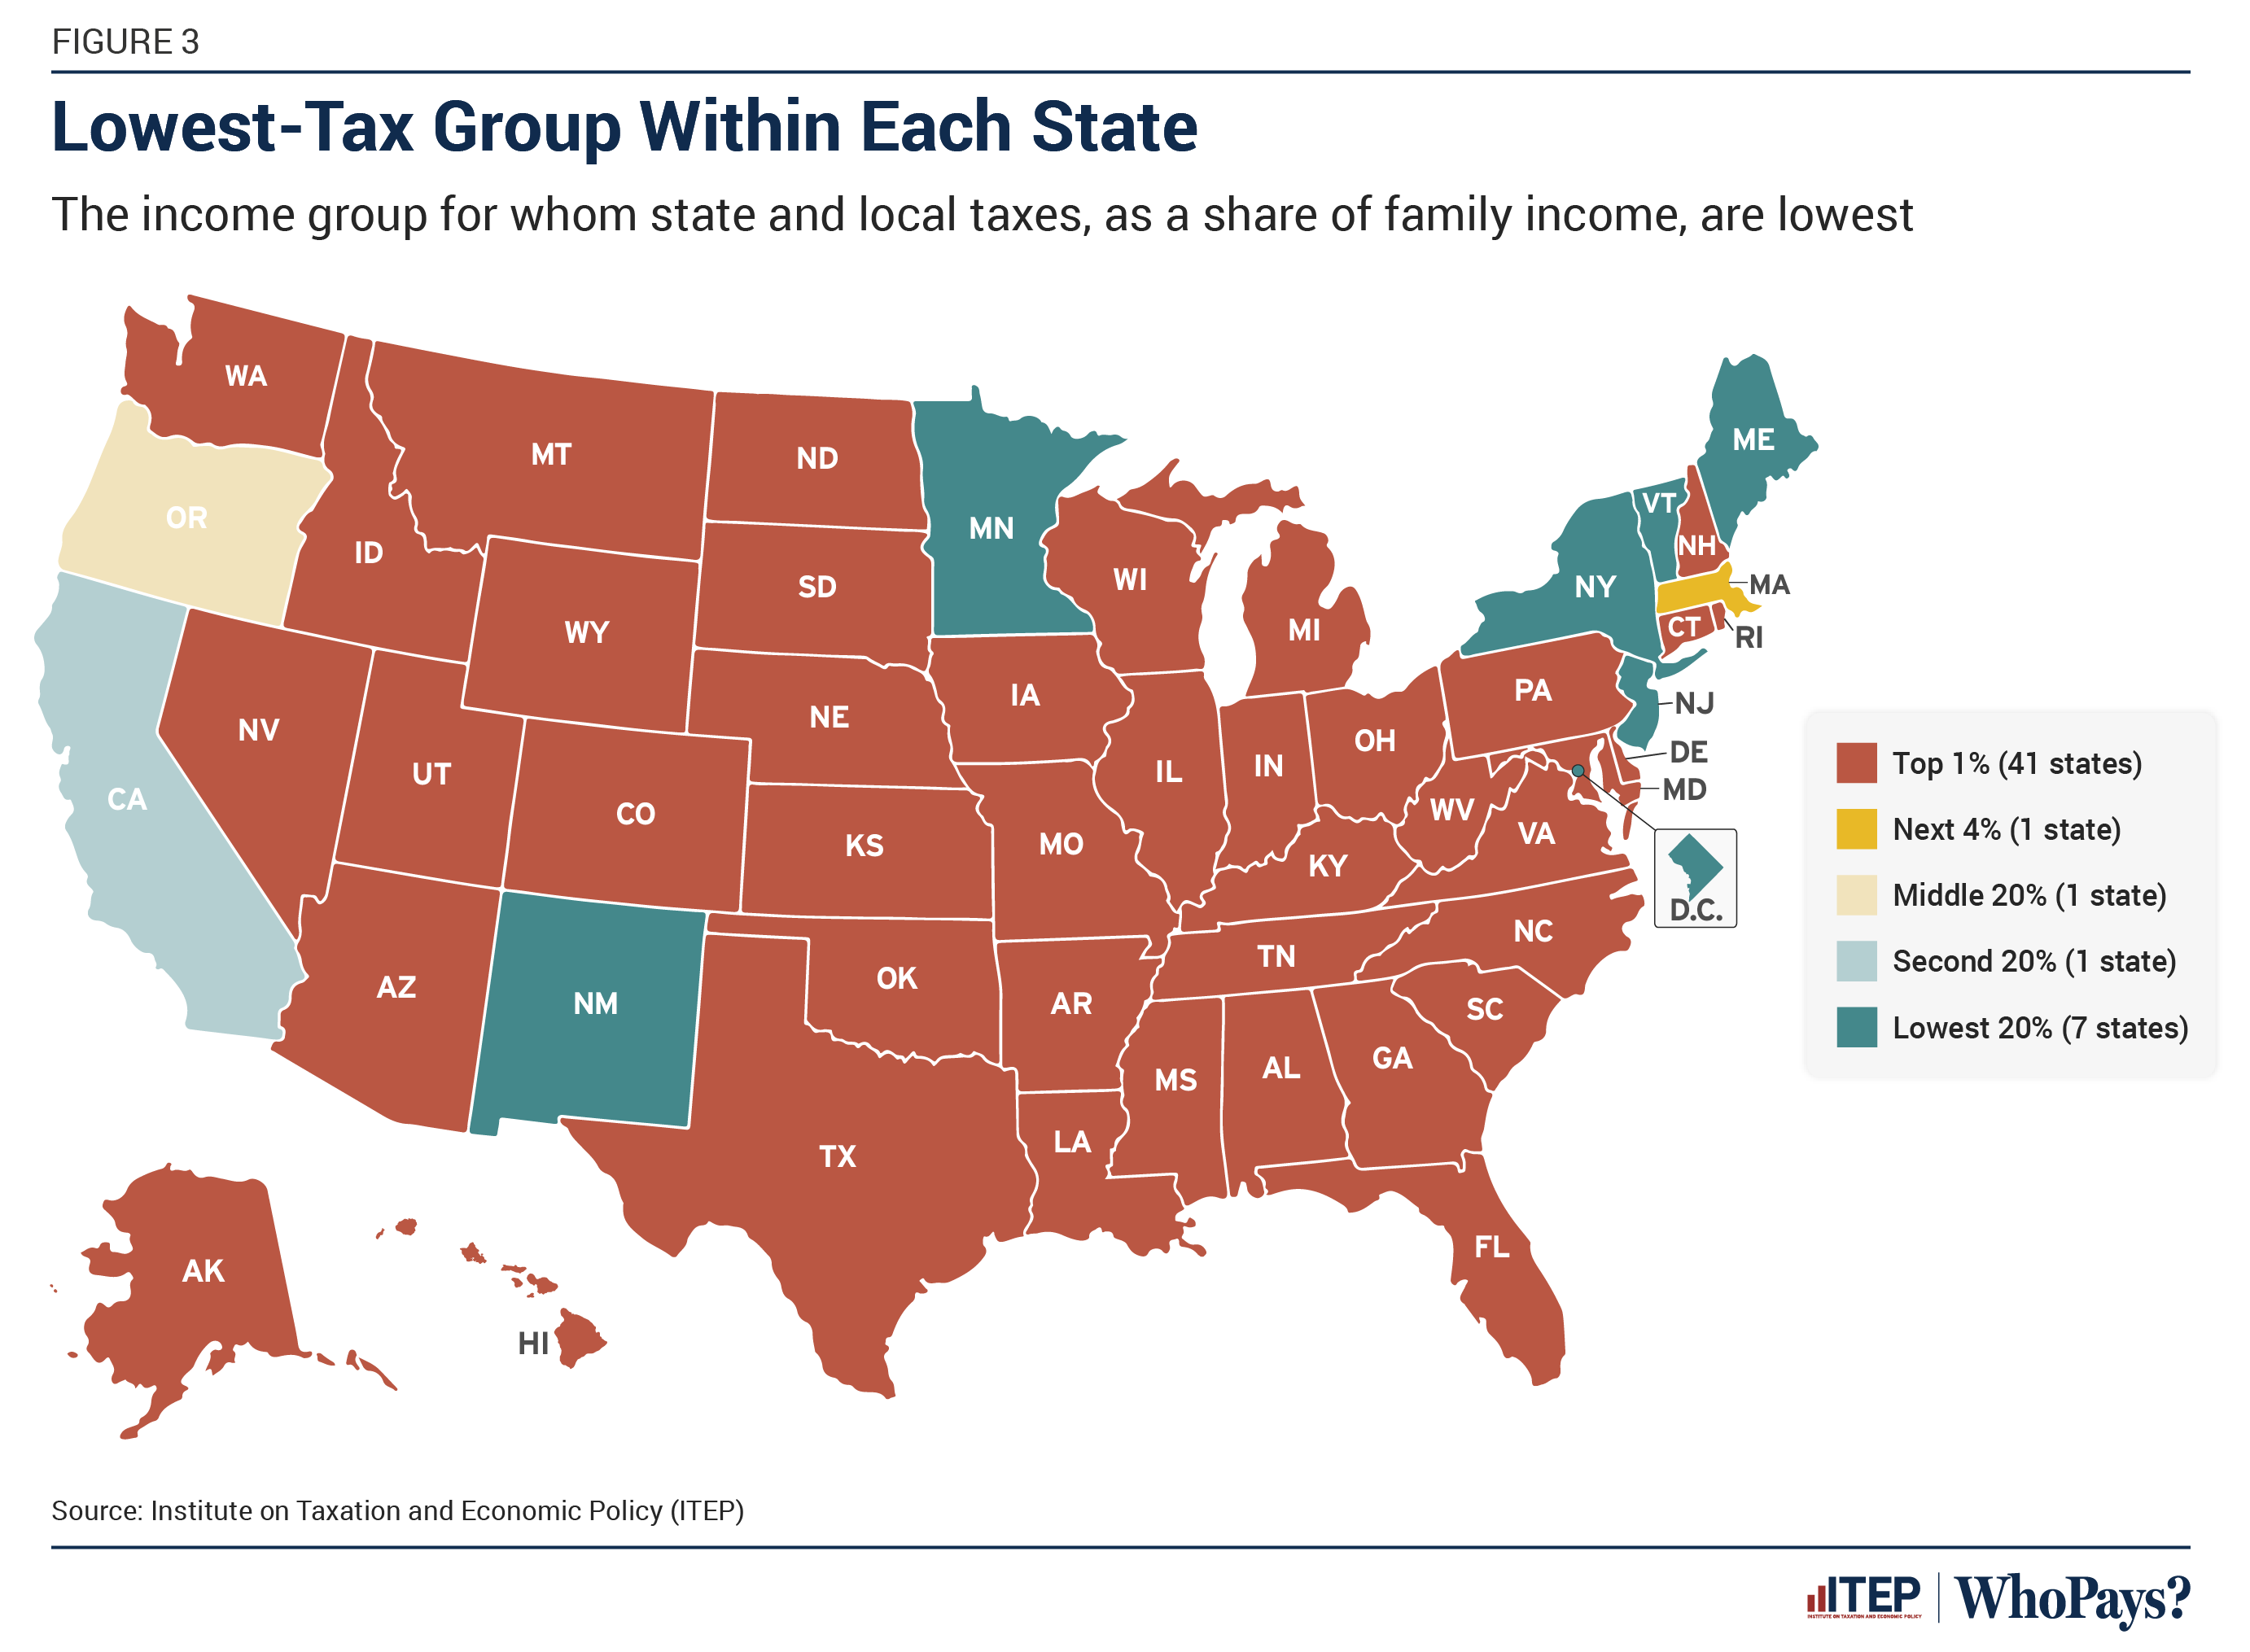
Lowest-taxed group in each state of the United States
(lemmy.world)
A place to share and discuss visual representations of data: Graphs, charts, maps, etc.
DataIsBeautiful is for visualizations that effectively convey information. Aesthetics are an important part of information visualization, but pretty pictures are not the sole aim of this subreddit.
A place to share and discuss visual representations of data: Graphs, charts, maps, etc.
  A post must be (or contain) a qualifying data visualization.

  Directly link to the original source article of the visualization
    Original source article doesn't mean the original source image. Link to the full page of the source article as a link-type submission.
    If you made the visualization yourself, tag it as [OC]

  [OC] posts must state the data source(s) and tool(s) used in the first top-level comment on their submission.

  DO NOT claim "[OC]" for diagrams that are not yours.

  All diagrams must have at least one computer generated element.

  No reposts of popular posts within 1 month.

  Post titles must describe the data plainly without using sensationalized headlines. Clickbait posts will be removed.

  Posts involving American Politics, or contentious topics in American media, are permissible only on Thursdays (ET).

  Posts involving Personal Data are permissible only on Mondays (ET).
Please read through our FAQ if you are new to posting on DataIsBeautiful. Commenting Rules
Don't be intentionally rude, ever.

Comments should be constructive and related to the visual presented. Special attention is given to root-level comments.

Short comments and low effort replies are automatically removed.

Hate Speech and dogwhistling are not tolerated and will result in an immediate ban.

Personal attacks and rabble-rousing will be removed.

Moderators reserve discretion when issuing bans for inappropriate comments. Bans are also subject to you forfeiting all of your comments in this community.
Originally r/DataisBeautiful
Because you are forgetting of the net benefit of taxes that have been paid for decades before you were born, which improved everyone's standing to allow for:
The training of your teachers to allow you to get your education.
The city infrastructure that allowed you easy access to school, and later to your profession.
The social stability for your business to thrive.
The quality of life for your business's customers, allowing them to afford to be customers, allowing the business to afford your $500k a year.
You do not live in a vacuum. If all the people who make $50k a year disappeared it would significantly negatively impact your life. "A rising tide raises all ships", and a society on which everyone can thrive benefits everyone in that society. You can afford to pay a higher % and still thrive, in order to ease the burden on someone who is struggling.
You're argument of "I make more money than I need, I should keep it and let other people starve" isn't very compelling.