1

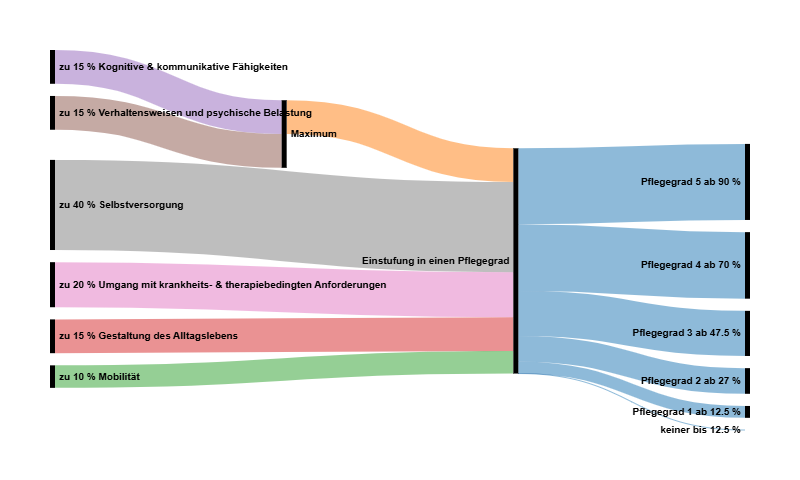
My attempt just utilizing the Sankey chart of https://app.rawgraphs.io/. I also worked in their second bad chart (= blue half.)
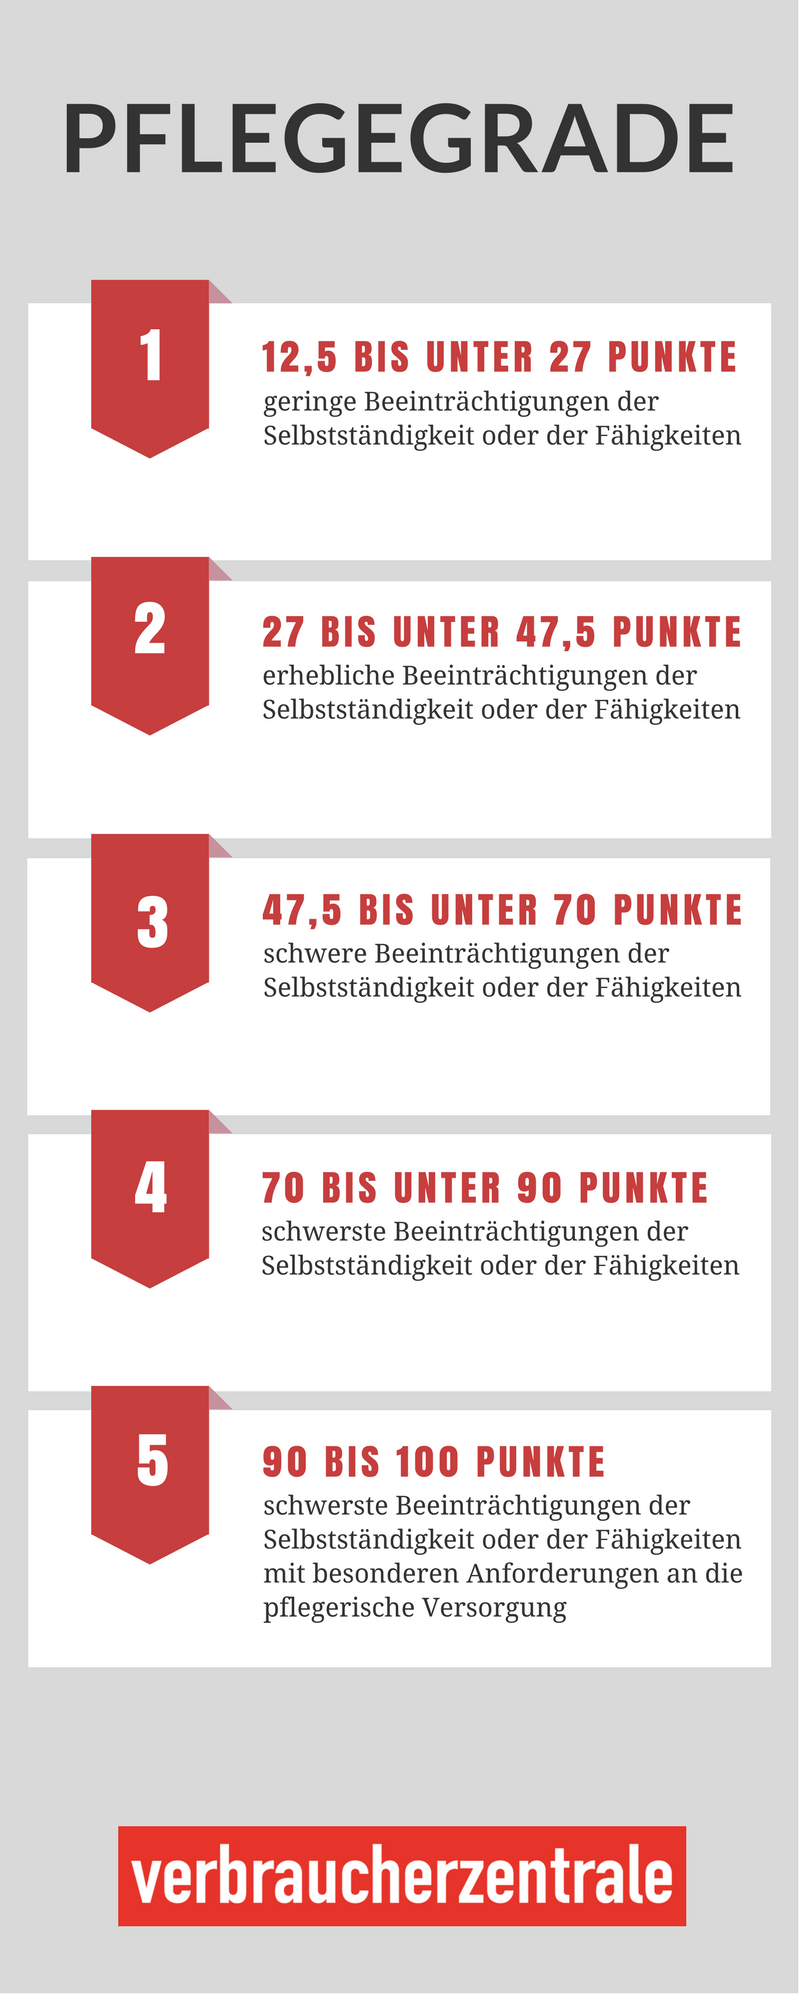
It's not exactly a Sankey because the blue part isn't an actual split but several thresholds.
My attempt just utilizing the Sankey chart of https://app.rawgraphs.io/. I also worked in their second bad chart (= blue half.)
It's not exactly a Sankey because the blue part isn't an actual split but several thresholds.
Pushing they layouter to the limits.
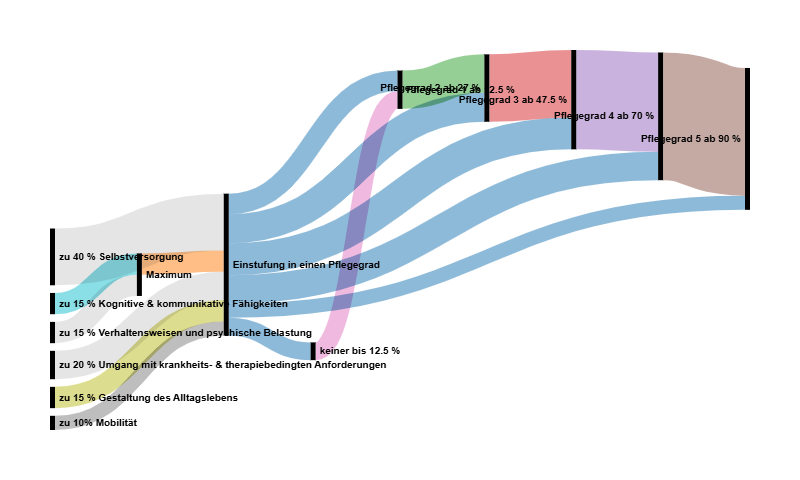
Logo adapted from VectorStock / Razzan99
Welcome! This is where information gets condensed and presented in an easily digestable manner. We encourage all forms of statistics, including text/tables for the visually challenged.
Unless you made the graphics yourself (preface title with [OC]), please credit the author(s). Cite your sources whenever possible. I will occasionally update and tidy-up the sidebar. Thanks for reading!