1
Guess the original (media.piefed.social)
submitted 2 months ago* (last edited 2 months ago) by suff@piefed.social to c/dataviz

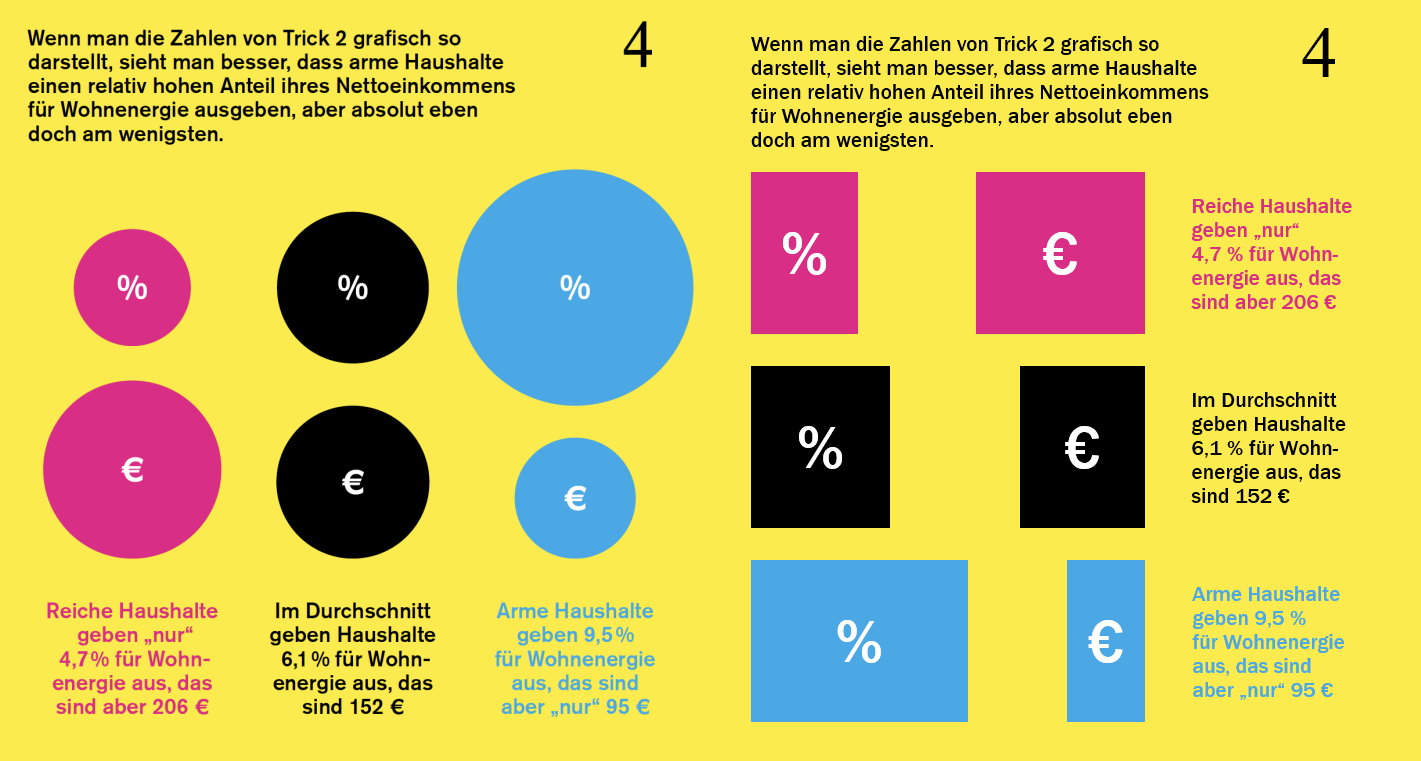
Ironically, I found the pie chart (!) on a German site about manipulation with statistics.

Oh dear, they used Area Circles, too.

image

no comments (yet)
sorted by: hot top controversial new old
there doesn't seem to be anything here
this post was submitted on 10 Nov 2025
1 points (100.0% liked)

Dataviz and Infographics

36 readers
1 users here now

Logo adapted from VectorStock / Razzan99

Welcome! This is where information gets condensed and presented in an easily digestable manner. We encourage all forms of statistics, including text/tables for the visually challenged.

Unless you made the graphics yourself (preface title with [OC]), please credit the author(s). Cite your sources whenever possible. I will occasionally update and tidy-up the sidebar. Thanks for reading!

founded 2 years ago
MODERATORS