17

According to a Global Energy Monitor report, India is developing more than 60% of the world's new coal-based blast furnace capacity. Together with China, the two nations account for 86% of such planned projects globally.

Currently, 319 million tons per annum of this carbon-heavy capacity is either under construction or announced, despite the steel industry already contributing 11% of global carbon dioxide emissions.

Transitioning to cleaner methods remains slow. Only 34% of global steelmaking uses electric arc furnaces, and just 2% of direct reduced iron capacity uses green hydrogen.

Although 93% of India's upcoming ironmaking relies on coal-intensive methods, only 5% of that capacity has broken ground. This low start rate leaves room for intervention to promote lower-emission technologies before these long-term fossil fuel assets are finalized.

...

“The outlook remains bleak for steel’s transition away from fossil fuels. The ball is in India and China’s court, as the two countries plan 86% of new coal-based capacity. Pivoting to lower-emissions technologies and using existing EAF capacity more effectively are two immediate steps the countries can take to have a profound effect on the direction of the steel industry," says Astrid Grigsby-Schulte, Project Manager of the Global Iron and Steel Tracker at Global Energy Monitor.

...

no comments (yet)
sorted by: hot top controversial new old
there doesn't seem to be anything here
this post was submitted on 16 May 2026
17 points (94.7% liked)

Climate

8669 readers
335 users here now

Discussion of climate, how it is changing, activism around that, the politics, and the energy systems change we need in order to stabilize things.

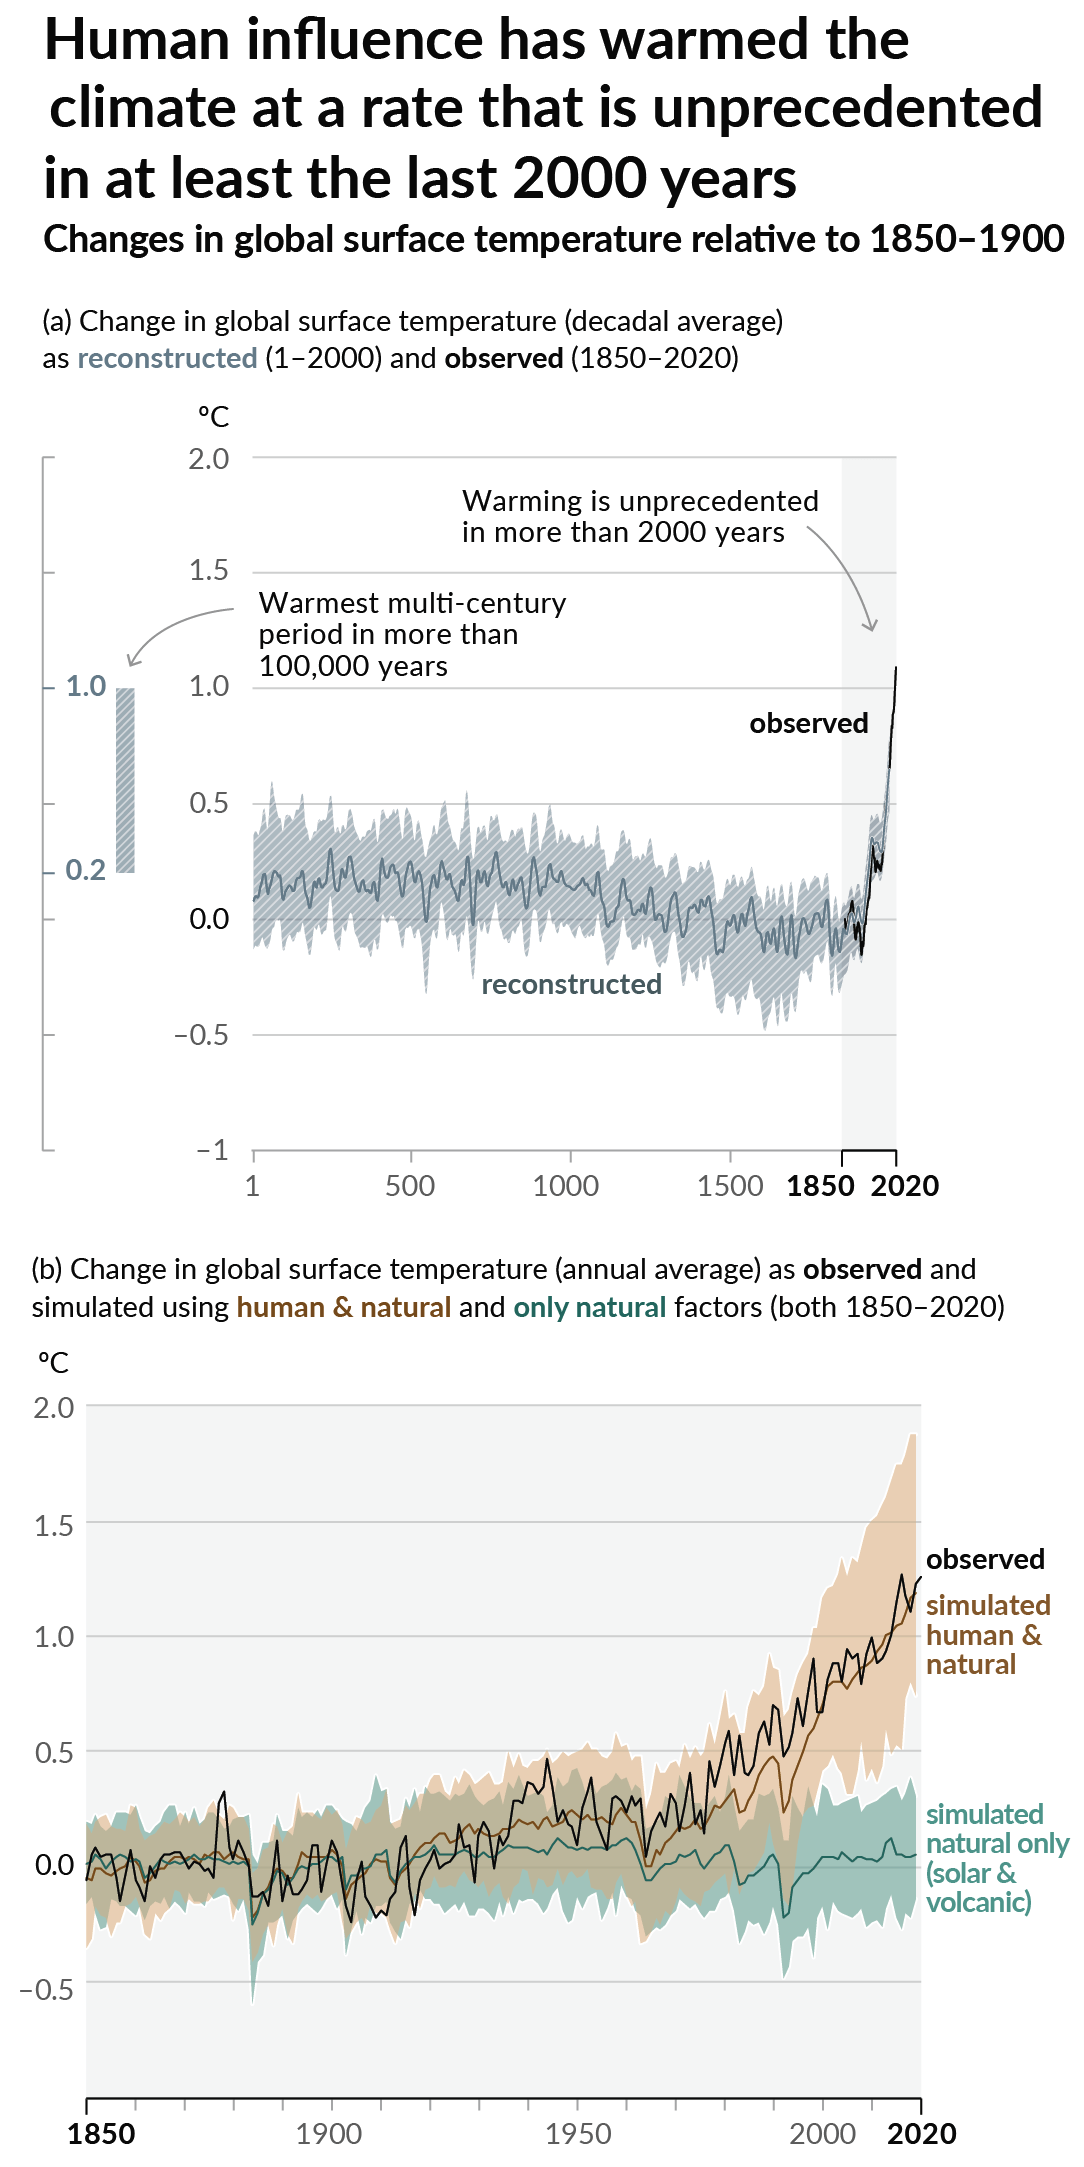
As a starting point, the burning of fossil fuels, and to a lesser extent deforestation and release of methane are responsible for the warming in recent decades: Graph of temperature as observed with significant warming, and simulated without added greenhouse gases and other anthropogentic changes, which shows no significant warming
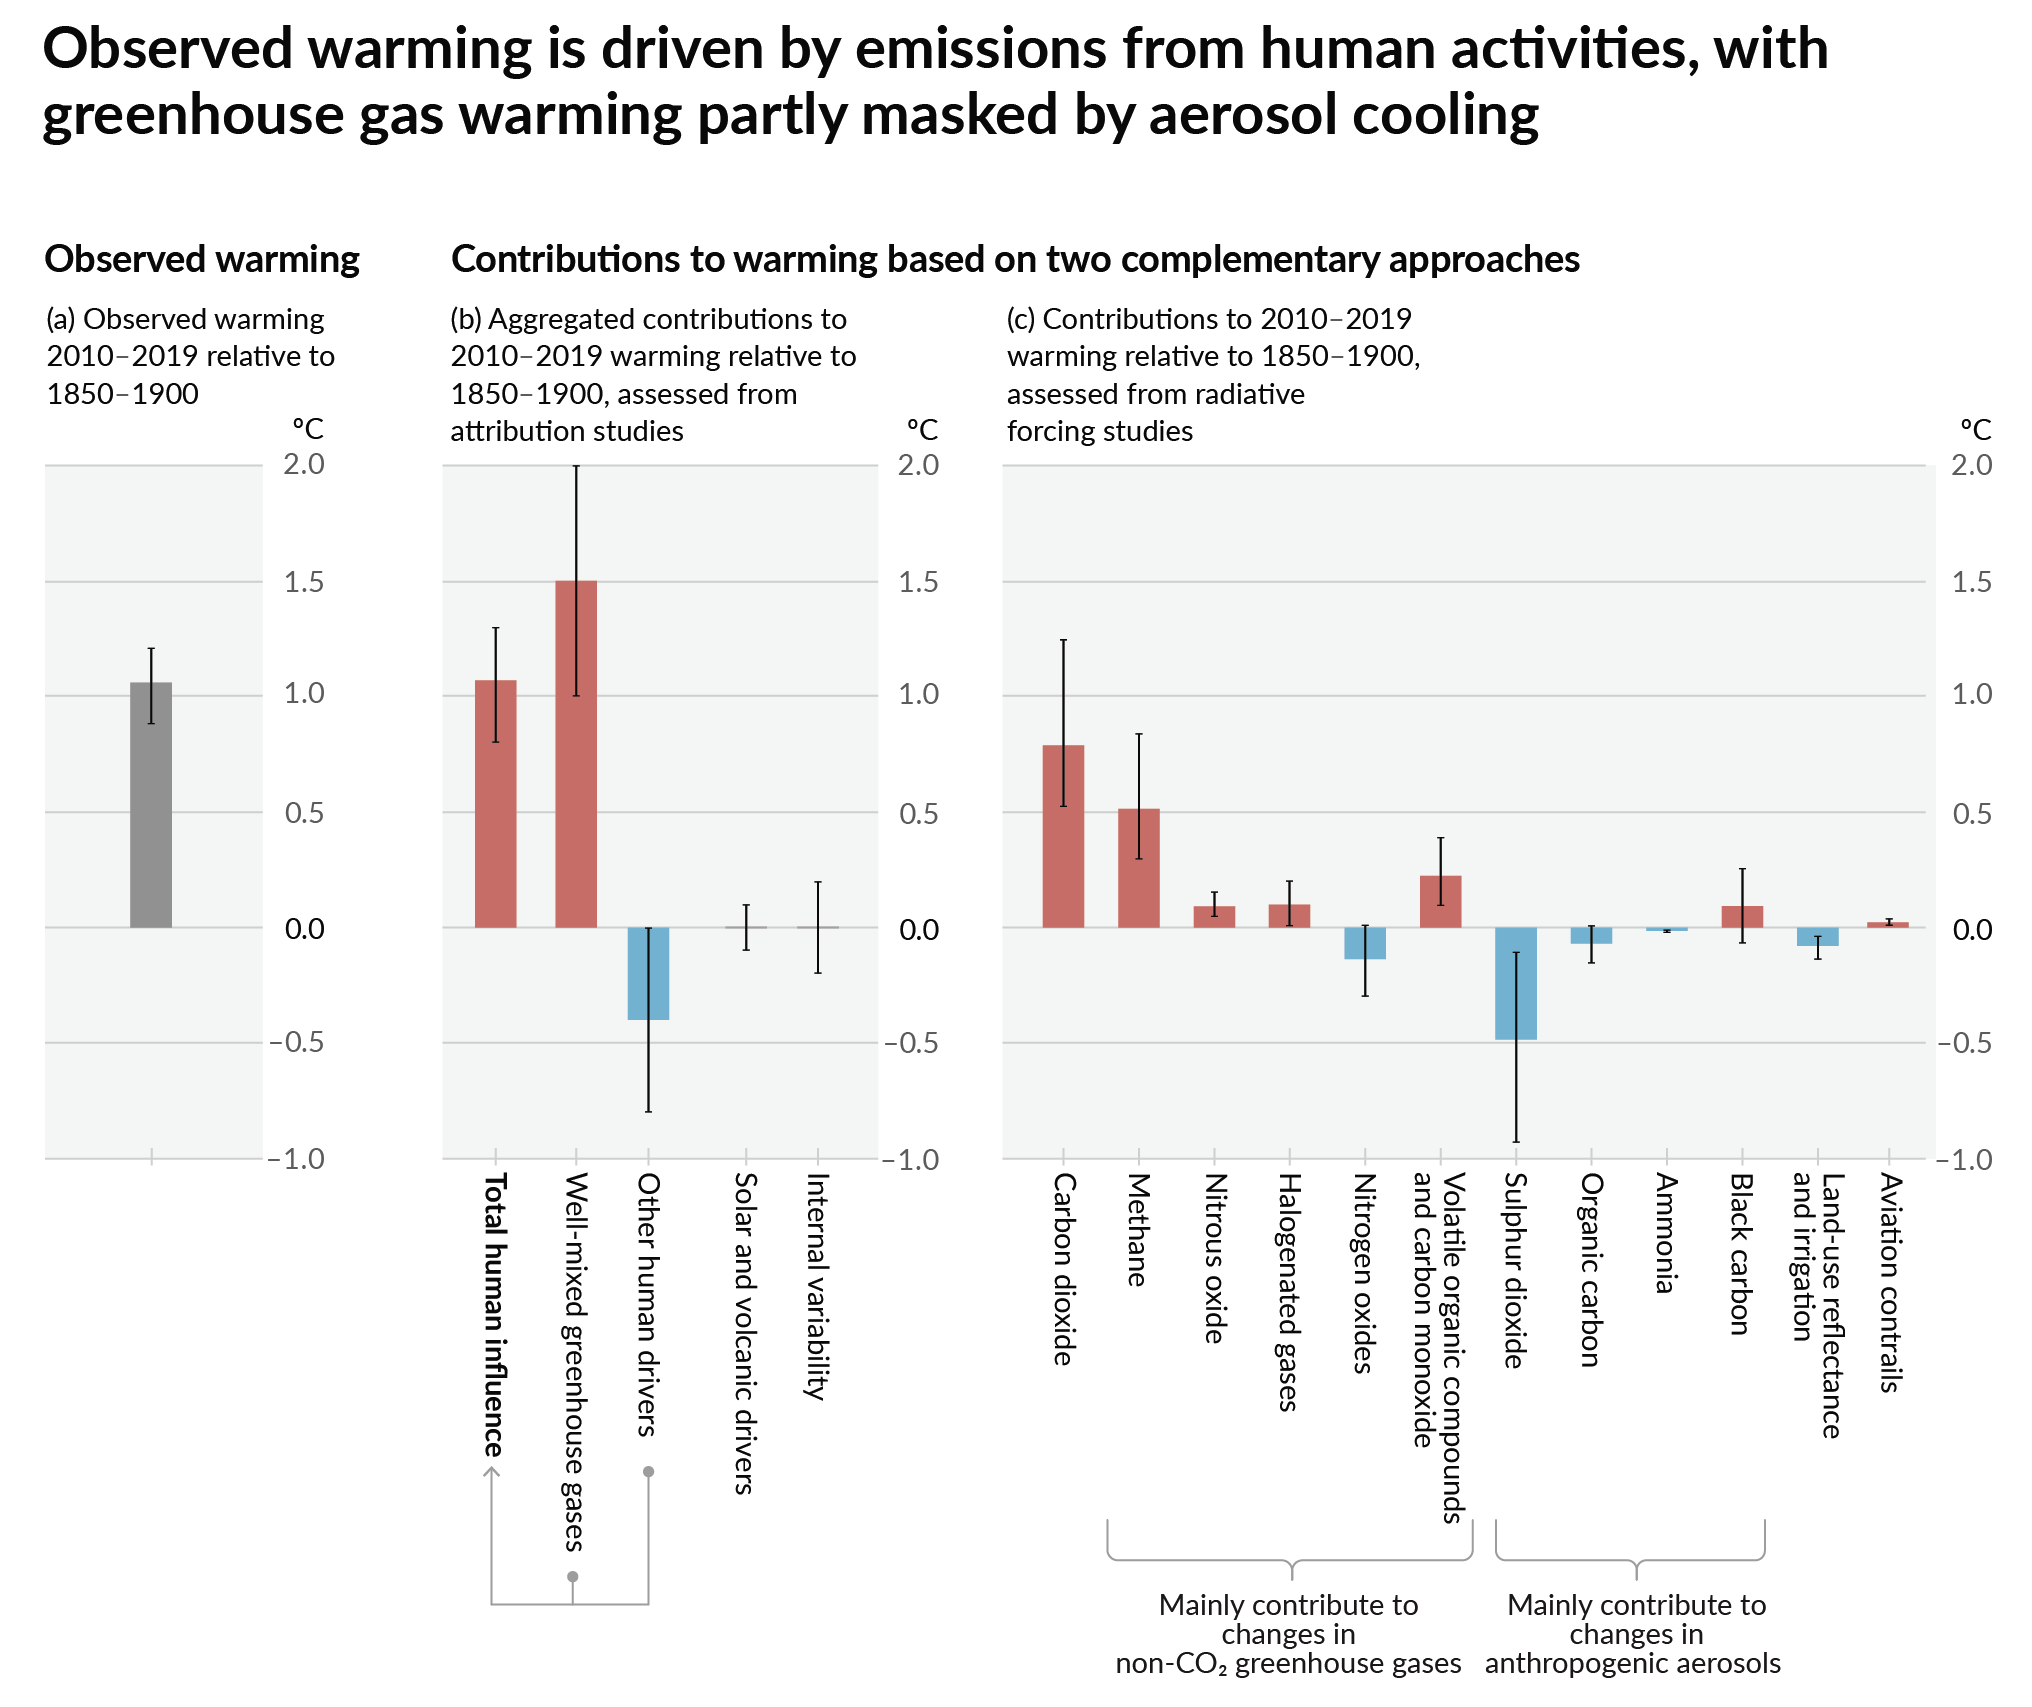
How much each change to the atmosphere has warmed the world: IPCC AR6 Figure 2 - Thee bar charts: first chart: how much each gas has warmed the world.  About 1C of total warming.  Second chart:  about 1.5C of total warming from well-mixed greenhouse gases, offset by 0.4C of cooling from aerosols and negligible influence from changes to solar output, volcanoes, and internal variability.  Third chart: about 1.25C of warming from CO2, 0.5C from methane, and a bunch more in small quantities from other gases.  About 0.5C of cooling with large error bars from SO2.
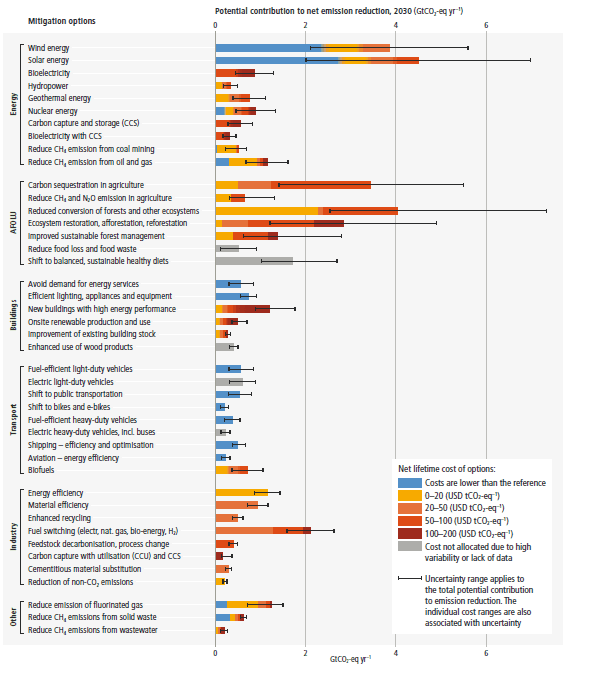
Recommended actions to cut greenhouse gas emissions in the near future:
Anti-science, inactivism, and unsupported conspiracy theories are not ok here.

founded 2 years ago
MODERATORS