13
you are viewing a single comment's thread
view the rest of the comments
view the rest of the comments
this post was submitted on 04 Oct 2023
13 points (71.0% liked)
United States | News & Politics
7124 readers
856 users here now
founded 4 years ago
MODERATORS
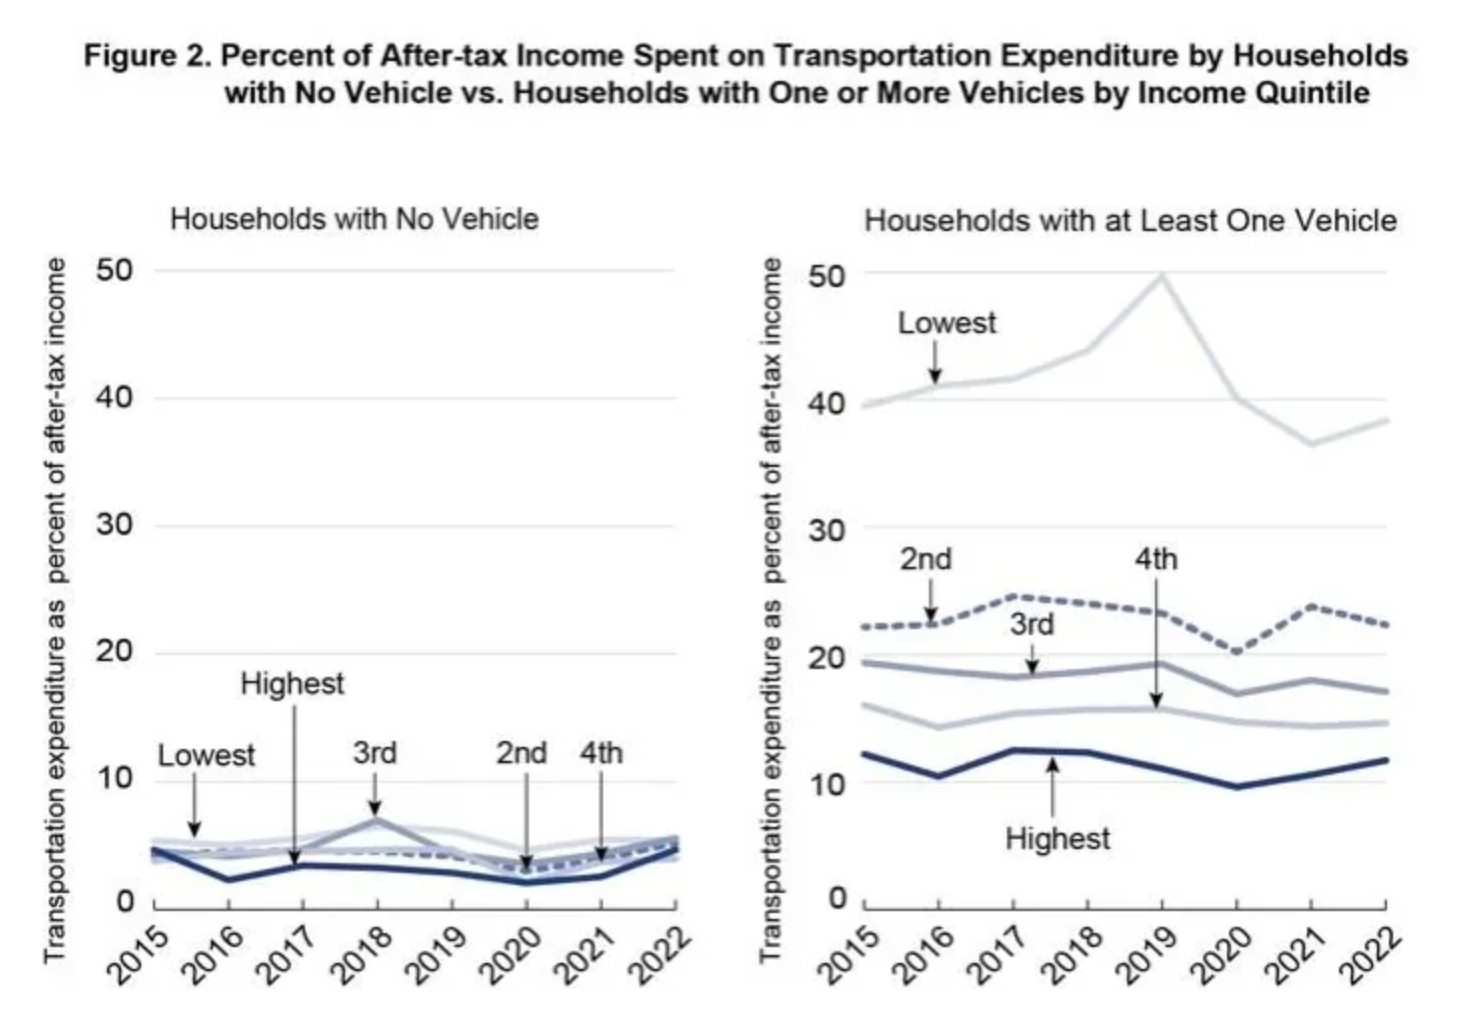
Is income quintile using the same cutoff on botj graphs or computed for the two populations seperately? Shocked there's almost no difference in transportation costs in the no vehicle group. Is there more geographic variance?
(I'm certain public transit is cheaper than car ownership, just that part of the data looks odd, might be a visualization issue)
some more details here https://data.bts.gov/stories/s/Transportation-Economic-Trends-Transportation-Spen/ida7-k95k/
The income cutoff is the same, but the size of each quintile is radically different in the no car section. Only 3% of the top 2 quintiles don't own a car, while it's 11-17% in the other 3 quintiles. The data for the top two quintiles is basically irrelevant.