695
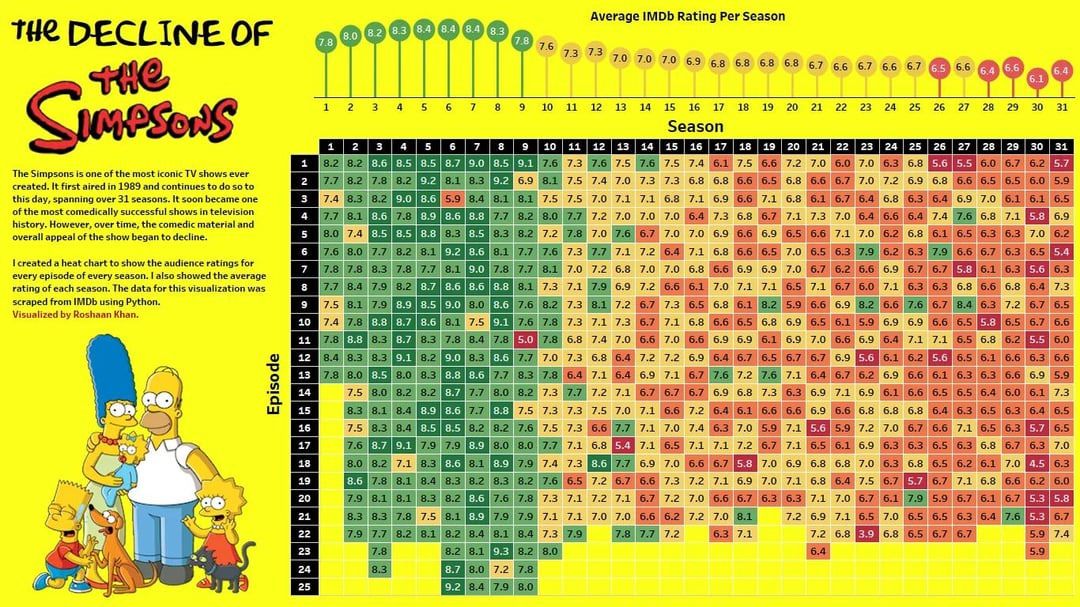
The decline of the Simpsons 📉
(jlai.lu)
A place to share and discuss data visualizations. #dataviz
The graphic shows a stellar first 9 seasons, a medium next 15 seasons, and a terrible last 8 seasons... so the majority of them are medium with equal about good and bad episodes.