1
1
World’s Top 20 Healthcare Companies by Market Cap
(lemmy.world)
Source: MarketCapWatch

Explanation:
I wanted to have visual proof/aid to model the total amount of microstates a finite binary system is able to access is related to the binomial coefficents and pascals triangle.
Each horizontal row of pascals triangle corrisponds to a computational system of N bits. The amount of unique distinct microstates they can represent has a structural founding in algebraic combinatorics.
The central binomial coefficents represent average states of high entropy while the outer coefficents corrispond to more ordered unique states of information that are harder to get to computationally.

Source: https://www.marketcapwatch.com/all-countries/
This treemap compares the market capitalization of listed companies across the world’s major blocs. The United States dominates with $69.9T, followed by China at $19.8T. Japan ($7.2T), the UK ($4.2T), France ($3.2T), Canada ($3.8T), and Germany ($2.9T) round out the G7, while India ($5.1T),Saudi Arabia ($2.5T), and others highlight BRICS’ growing presence. The “Rest of the World” collectively accounts for $24.7T.

Context: Searching for a new senior level software development job over a 9 week period in summer 2025.

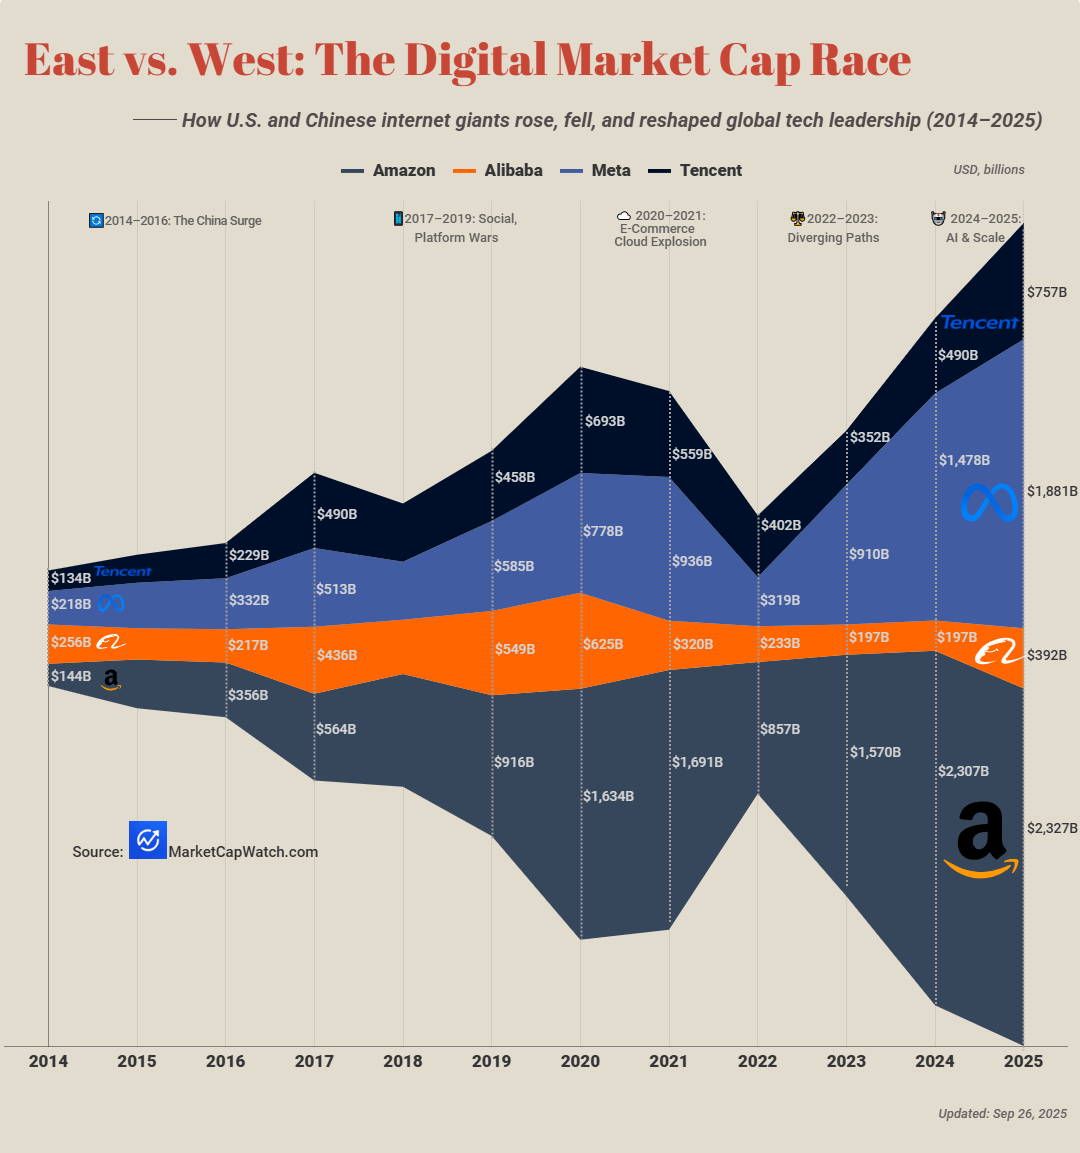
This chart tracks the shifting market cap of four internet powerhouses — Amazon, Meta, Alibaba, and Tencent — over the past decade. It highlights how U.S. firms surged ahead while Chinese peers peaked earlier and then slowed under regulatory and market pressures. 🔄 2014–2016: The China Surge Alibaba and Tencent rose rapidly on the back of China’s e‑commerce boom and mobile internet adoption, briefly rivaling U.S. tech peers.
📱 2017–2019: Social & Platform Wars Meta (Facebook) and Tencent both peaked as social platforms dominated global digital attention. Amazon’s steady climb reflected the shift to online retail and cloud.
☁️ 2020–2021: E‑Commerce & Cloud Explosion Amazon surged past $1.6T during the pandemic as e‑commerce and AWS cloud demand skyrocketed. Meta also hit near‑$1T, while Alibaba and Tencent reached their highs before regulatory headwinds.
⚖️ 2022–2023: Diverging Paths Chinese tech valuations cooled under regulation and slowing growth, while U.S. peers rebounded. Meta dipped sharply in 2022 but recovered with its AI pivot.
🤖 2024–2025: AI & Scale Amazon and Meta both crossed multi‑trillion valuations, driven by AI integration and cloud dominance. Tencent stabilized, while Alibaba lagged, showing the widening gap between U.S. and Chinese tech giants.
Source: MarketCapWatch
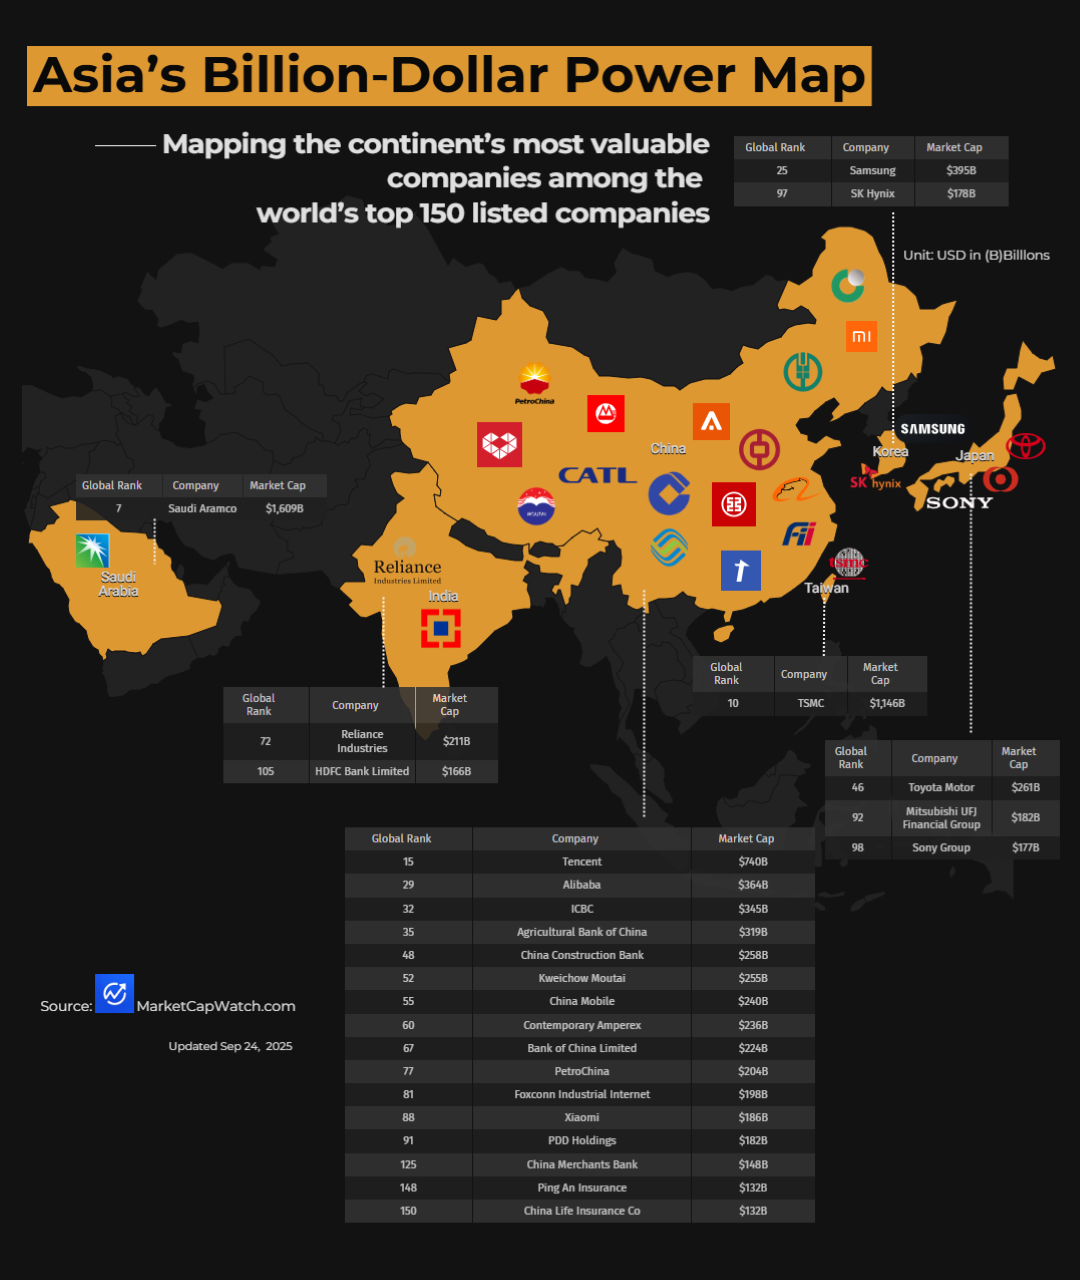
Where the region’s biggest companies stand in the global market cap hierarchy
Source: MarketCapWatch
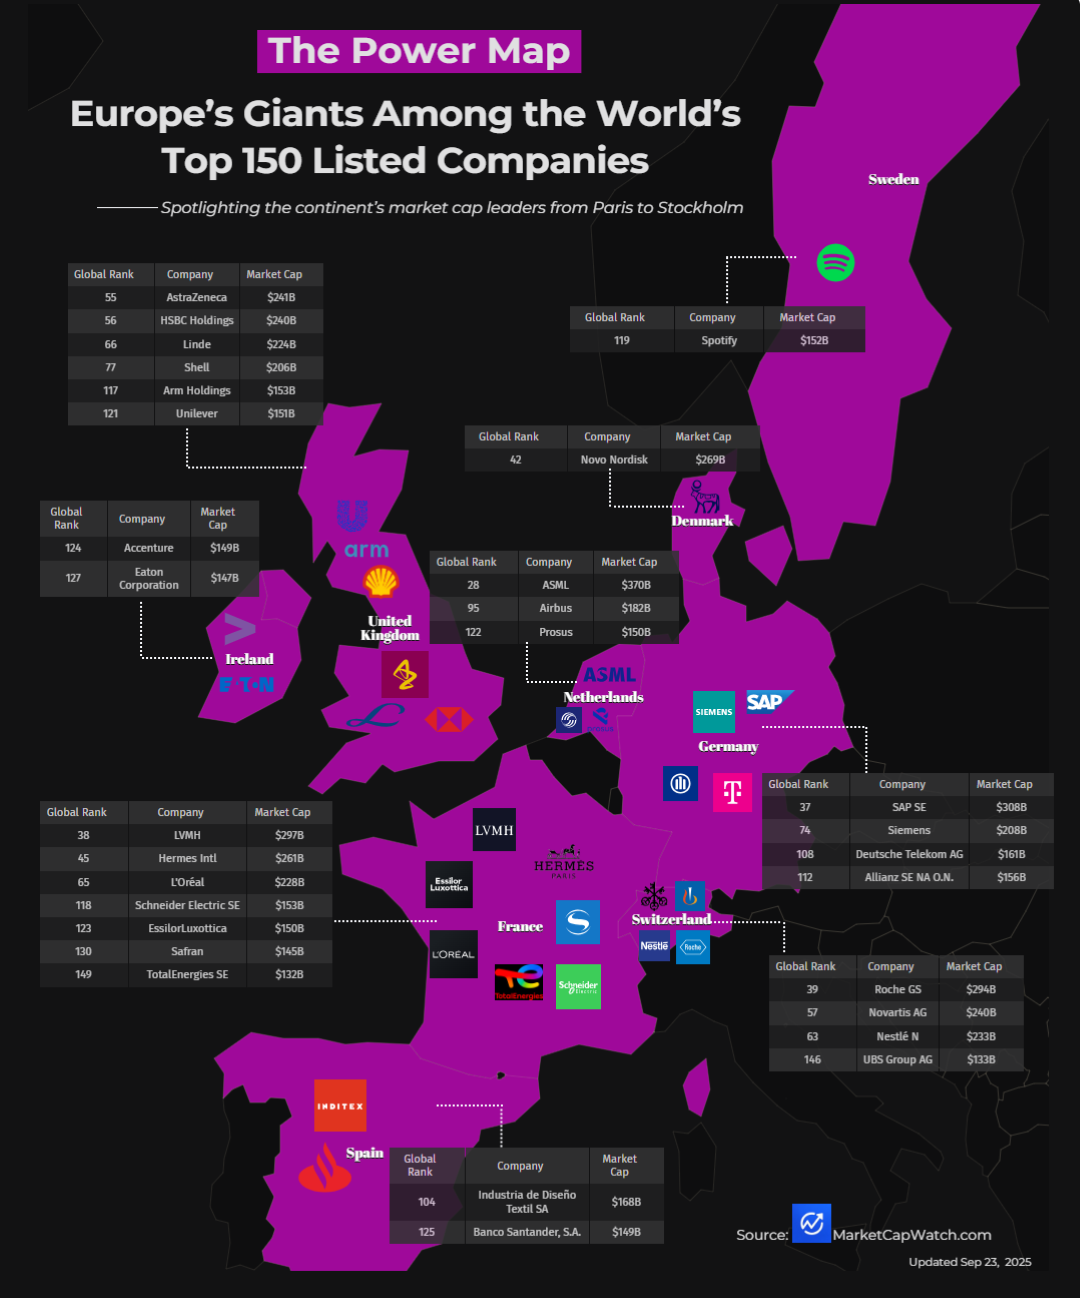
Spotlighting the continent’s market cap leaders from Paris to Stockholm Source: MarketCapWatch
2014 → 2016: Oil Price Collapse & CapEx Cuts What happened: Crude oil prices plunged from over $100/barrel in mid‑2014 to below $30 by early 2016.
Impact: All four companies saw steep market cap declines as revenues fell and capital expenditure plans were slashed. ConocoPhillips, more exposed to upstream volatility, dropped the most.
2016 → 2018: Recovery & OPEC+ Cuts What happened: OPEC+ production cuts and gradual demand recovery lifted oil prices back toward $70/barrel.
Impact: Market caps rebounded, with Shell and Chevron benefiting from integrated operations and downstream stability.
2018 → 2020: Trade Tensions & COVID‑19 Shock What happened: Late‑2018 oil price volatility from U.S.–China trade tensions was followed by the 2020 pandemic, which caused an unprecedented demand collapse.
Impact: Market caps plunged in 2020 — Shell and Exxon hit multi‑year lows, and ConocoPhillips fell below $50B.
2020 → 2022: Energy Price Supercycle What happened: Post‑pandemic demand recovery, supply constraints, and the Russia–Ukraine conflict in 2022 drove oil prices above $100/barrel.
Impact: All four companies surged in value, with ExxonMobil and Chevron hitting decade highs. ConocoPhillips more than tripled from its 2020 low.
2022 → 2023: Price Normalization What happened: Oil prices eased from 2022 peaks as supply stabilized and recession fears grew.
Impact: Market caps dipped slightly, though still well above pre‑pandemic levels.
2023 → 2025 (YTD): Diverging Strategies & Investor Sentiment What happened:
ExxonMobil hit record highs (~$481B) on strong refining margins and disciplined spending.
Chevron rebounded sharply in 2025 after strategic acquisitions and buybacks.
Shell faced investor pressure over its energy transition pace, keeping valuations more muted.
ConocoPhillips stabilized after earlier gains, reflecting a more balanced oil price outlook.
Data Source: MarketCapWatch

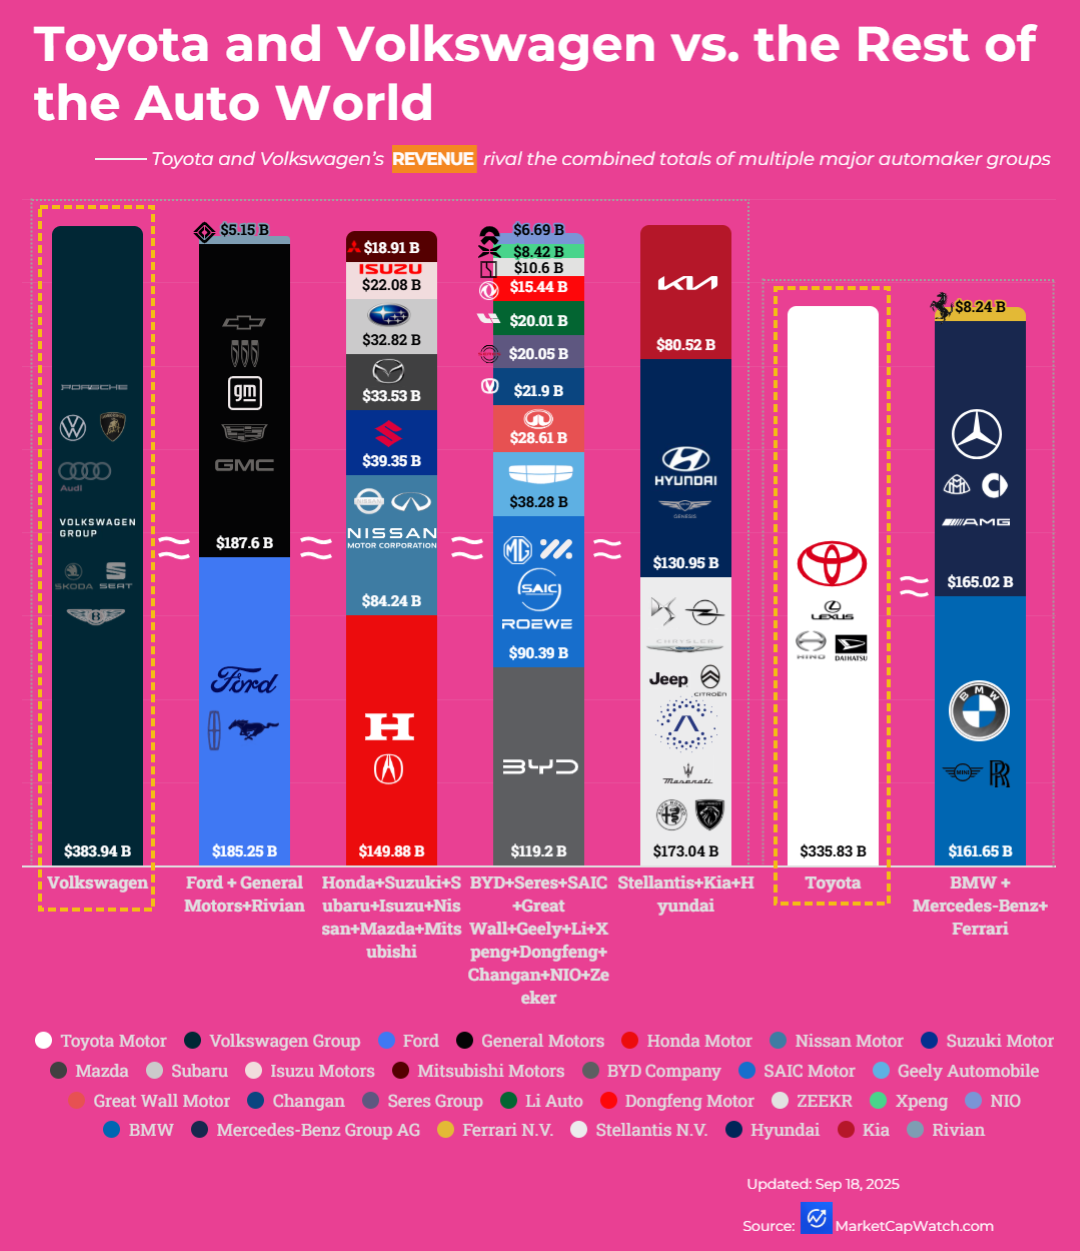
This chart breaks down the revenues for the world’s largest carmakers, grouping brands under their parent companies. The standout insight: Toyota and Volkswagen each generate annual sales on par with the combined totals of several other major automaker groups.
Toyota’s revenue rivals the sum of BMW + Mercedes‑Benz, while Volkswagen’s is close to Ford + GM combined.
Source: MarketCapWatch
Source: 1. MarketCapWatch 2. Wccftech

This heatmap shows the number of publicly listed companies headquartered in each U.S. state, based on MarketCapWatch data. Darker blues mark states with higher corporate density, lighter blues indicate fewer listings.

This chart maps the world’s 30 most valuable companies — from Bank of America (founded 1784, Bank of America market cap is $375B) to NVIDIA (founded 1993, Nvidia market cap is $4.32T) — showing how corporate age and market value intersect.
Older institutions like JPMorgan Chase (1799) and Procter & Gamble (1837) remain global heavyweights, but the upper‑right corner is dominated by younger tech titans: Microsoft, Apple, Alphabet, Amazon, and Meta. Outliers like Saudi Aramco (1933, $1.49T) prove that energy can still rival tech in scale.

Starting at $163B in 2000, Oracle’s market cap was halved by the dot‑com crash, bottoming near $57B in 2002. The company rebuilt through the mid‑2000s, only to face another dip during the 2008 financial crisis. Its 2015–2018 cloud pivot laid the groundwork for renewed growth, but the real inflection came post‑2020 — fueled by cloud infrastructure dominance, database leadership, and the AI wave — propelling Oracle to $865B by 2025.

This map spotlights the largest publicly traded company headquartered in each U.S. state, ranked by market capitalization as of September 2025. Source: MarketCapWatch

A place to share and discuss visual representations of data: Graphs, charts, maps, etc.
DataIsBeautiful is for visualizations that effectively convey information. Aesthetics are an important part of information visualization, but pretty pictures are not the sole aim of this subreddit.
A place to share and discuss visual representations of data: Graphs, charts, maps, etc.
  A post must be (or contain) a qualifying data visualization.

  Directly link to the original source article of the visualization
    Original source article doesn't mean the original source image. Link to the full page of the source article as a link-type submission.
    If you made the visualization yourself, tag it as [OC]

  [OC] posts must state the data source(s) and tool(s) used in the first top-level comment on their submission.

  DO NOT claim "[OC]" for diagrams that are not yours.

  All diagrams must have at least one computer generated element.

  No reposts of popular posts within 1 month.

  Post titles must describe the data plainly without using sensationalized headlines. Clickbait posts will be removed.

  Posts involving American Politics, or contentious topics in American media, are permissible only on Thursdays (ET).

  Posts involving Personal Data are permissible only on Mondays (ET).
Please read through our FAQ if you are new to posting on DataIsBeautiful. Commenting Rules
Don't be intentionally rude, ever.

Comments should be constructive and related to the visual presented. Special attention is given to root-level comments.

Short comments and low effort replies are automatically removed.

Hate Speech and dogwhistling are not tolerated and will result in an immediate ban.

Personal attacks and rabble-rousing will be removed.

Moderators reserve discretion when issuing bans for inappropriate comments. Bans are also subject to you forfeiting all of your comments in this community.
Originally r/DataisBeautiful