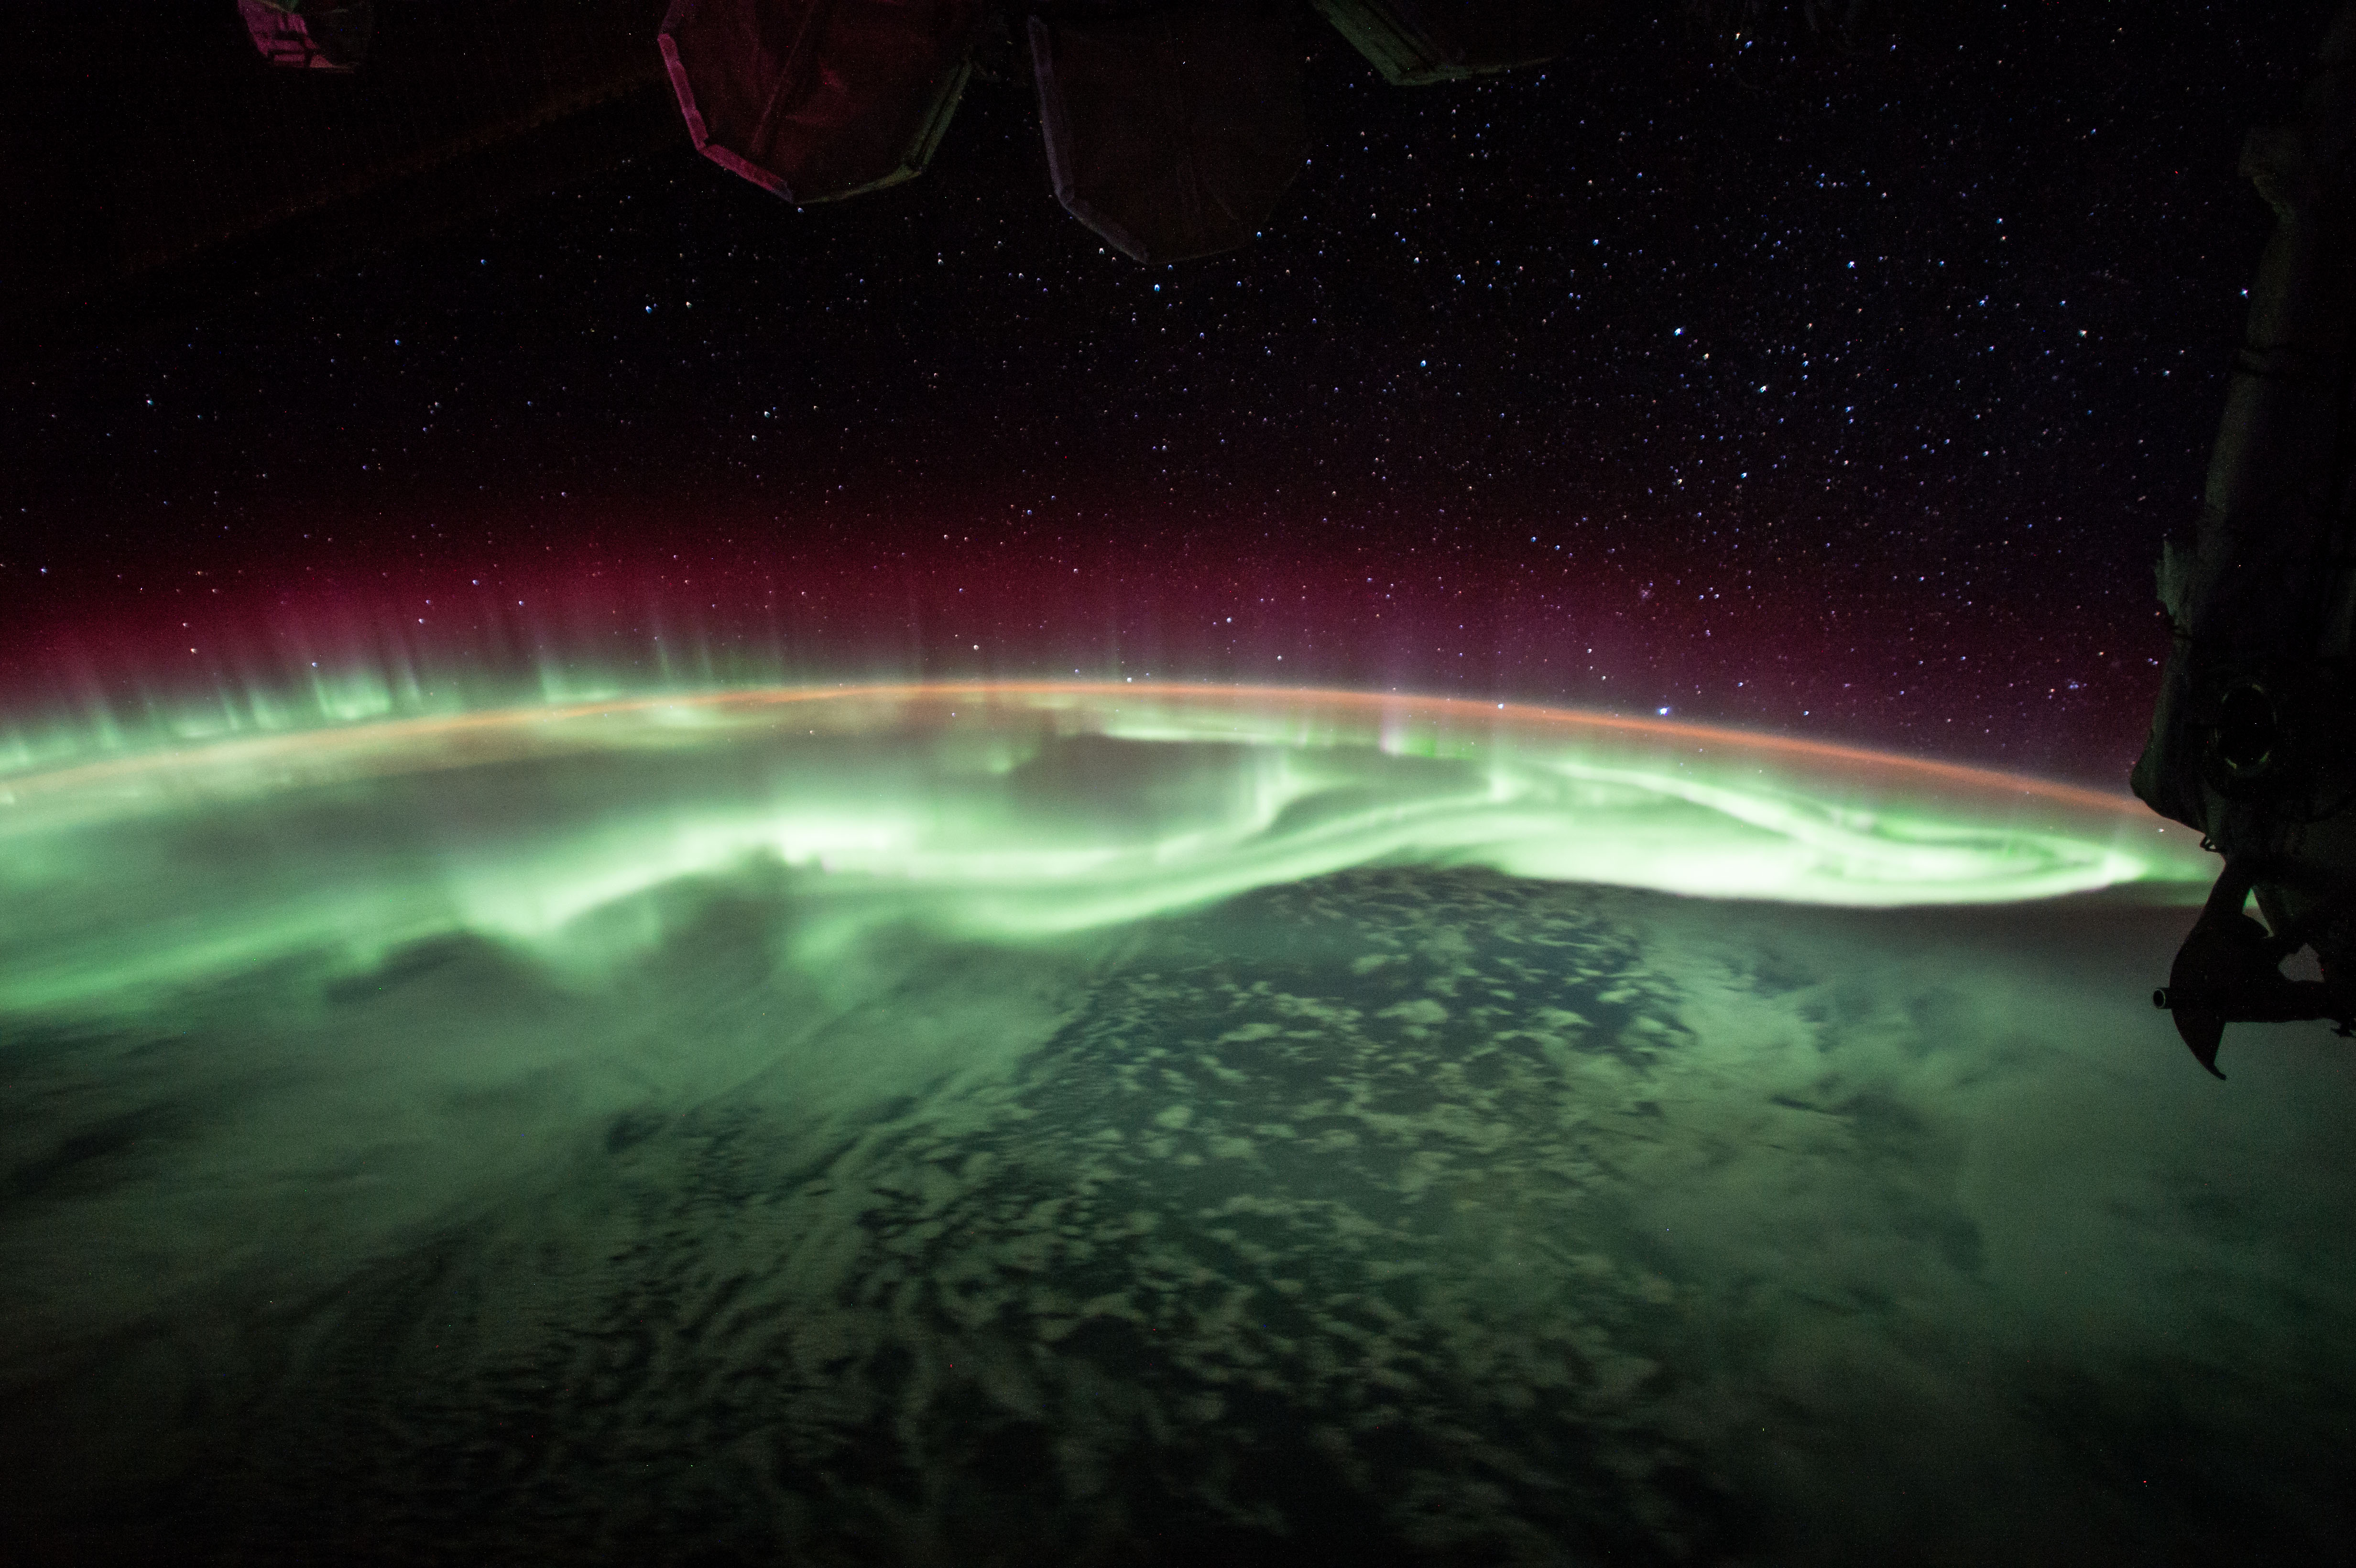
1
16
2
14
3
11

Please post any relevant links you would like to add to the resource collection on the sidebar! :) Eventually I will go through my bookmarks too! Any kind of tools, important websites or references are welcome.

4
20
5
3
6
25
7
6
8
7
9
15
submitted 6 days ago by cm0002@lemy.lol to c/earthscience@mander.xyz
10
14
11
13
12
17

The researchers say they are actually younger than previously understood.

The study uncovered that while the Twelve Apostles were pushed out of the sea over millions of years by shifting tectonic plates, it was only in the last few thousand years, after the last Ice Age, that coastal erosion exposed and shaped the towering rock pillars that we see today.

13
38
submitted 1 week ago by cm0002@lemy.lol to c/earthscience@mander.xyz

In China’s Chongqing Municipality, locals have known about the sinkhole for centuries. Xiaozhai is the name of a local abandoned village, whilst Tiankeng means Heavenly Pit, the local term for sinkhole.

With a depth of 626 metres and a width of 527 metres, the enormous hole is twice as long as the Eiffel Tower and one a half times wider than London’s O2 Arena. With a volume of around 120,000,000 cubic metres, it could hold the equivalent of 40,000 Olympic-sized swimming pools or about 500 Hindenburg-class zeppelins.

Sinkholes are deep holes in the ground that form when surface layers collapse into underground voids. They can appear gradually or suddenly, and are often caused by heavy rain, flooding, or human activities, such as building and mining.

In the case of the Xiaozhai Tiankeng, forces from above and below ground shaped its formation. Over tens of thousands of years, rain water seeped into the region’s porous limestone bedrock, widening crevices and leading to erosion. At the same time, a powerful underground river was hollowing out a network of subterranean caves and caverns. Then, at some point the surface gave way and the sinkhole appeared.

14
8

link to open access paper..

https://www.nature.com/articles/s41561-026-01969-4

a–c, Geographic distribution of the 25 estuaries included in this study across Europe (a), Asia (b) and North America (c). For each estuary, the historical (dark blue line) and modern (light blue line) tidal range profiles are plotted as a function of streamwise distance from the estuary mouth in kilometres. Where present, tidal barriers are indicated by vertical black dashed lines, typically located further inland rather than directly at the estuary mouth. The time periods for the historical and modern datasets are specified in the title of each subplot. N and S denote the northern and southern portions of San Francisco Bay, respectively, with the northern portion continuing into the Sacramento River. d, Attribution of tidal range changes to relative increases in mean high water (MHW) and decreases in mean low water (MLW) for selected tide gauges across the studied estuaries. The dark blue bars represent the historical tidal range, while the light blue bars indicate the modern tidal range. The percentages indicate the contribution of MHW or MLW changes to the total tidal range change, using the mean tide level (MTL) of the historical period as a reference. MTL is shown by vertical lines within the bars; its rate of change (mm yr−1) is shown below each tide gauge name. Tide gauges in d were selected for data quality, vertical datum consistency and inland location to isolate local human influences. The stations are intended as illustrative examples and are not necessarily representative of the entire estuary. Basemap data in a–c from the Global Self-consistent, Hierarchical, High-resolution Geography database (GSHHG; https://www.soest.hawaii.edu/pwessel/gshhg)86.

15
20

New research reveals that a rift in Earth’s crust is just a few million years away from splitting the continent of Africa into two—and creating a new ocean

The study: Necking of the active Turkana Rift Zone and the priming of eastern Africa for continental breakup

16
12

cross-posted from: https://infosec.pub/post/45417988

The “State of the Air” 2026 report finds that even after decades of successful efforts to reduce sources of air pollution, 44% of Americans—152.3 million people—are living in places that get failing grades for unhealthy levels of ozone or particle pollution. We found that nearly half of American children (46%, or 33.5 million people under the age of 18) live in counties that received a failing grade for at least one measure of air pollution. Ten percent of children (7.3 million people under age 18) live in counties with failing grades for all three measures. Infants, children and teens are especially vulnerable to the health harms of breathing air pollution. Their lungs are still developing, they breathe more air for their body size than adults, and they frequently spend more time outdoors.

17
25
18
7
19
17
20
16
21
24

link to open access paper..

https://agupubs.onlinelibrary.wiley.com/doi/10.1029/2025JB032785

Figure 1

Geological context and eruption rate for volcanism in East Sicily. (a) Simplified tectonic map of central Mediterranean area. (b) Map reporting the location of the volcanic products erupted during different periods of volcanic activity in East Sicily. These periods (Basal Tholeiitic, Timpe, Valle del Bove, and Stratovolcano) are referred as supersynthem stratigraphic unit in Mount Etna literature (Branca et al., 2011). Geological structures are from Mastrolembo Ventura et al. (2014). (c) Time averaged eruption rates versus age at Mount Etna. The values reported for the different supersynthem since 220 kyr are from Barreca et al. (2018), while the eruption rates for the basal tholeiitic period and the Hyblean Plateau are illustrative only.

Figure 7

Evidence for the presence of low melt fraction at the base of the lithosphere and its implication for the origin of magmas erupted at Mount Etna. (a) Map of Central America subduction zone indicating the location of profile shown in panel (c). Modified from Naif et al. (2013). (b) Map of south Italy showing the location of the profile shown in panel (d). (c) Cross section showing resistivity ratio from inversion of the seafloor magnetotelluric data in front of the Central America subduction zone (Naif et al., 2013). The color scale gives log(ρy/ρx), where ρy and ρx are the electric conductivity measured parallel to the plate motion and parallel to the Nicaragua trench axis, respectively. Black dots indicate the distribution of earthquakes within the subducting Cocos plate. Figure modified from initial Figure 2b from Naif et al. (2013). (d) Cross section of offshore Sicily illustrating the potential importance of low degree melts to explain the formation of magmas erupted on the Hyblean Plateau and at Mount Etna. Dots report the location of Mv > 3 earthquakes reported in the Italian Seismic Instrumental and parametric database (ISIDE; available at http://iside.rm.ingv.it/) projected on the profile reported in panel (a). Only earthquakes observed between longitude 14° and 17°E, and latitude between 36° and 40°N are reported. Earthquakes observed below Sicily mainland are reported in gray, while earthquakes associated to the subducting Ionian slab are color coded as a function of depth. The location of the subducting slab below the Tyrrhenian Sea is estimated from the locations of earthquakes as a function of depth. The melting zone at the base of the lithosphere is extrapolated from the zone observed for the Cocos plate subducting below Central America in panel (c).

Figure 10

Tectonic model for the magmatic evolution around Sicily and the formation of magmas at Mount Etna. (a, b) Paleogeography at 5 Ma associated with the formation of the Hyblean Plateau basalts. Subduction of the Nubia plate (northern margin of the African plate) beneath the Sicily block corresponding to the southern margin of the Eurasian plate flexures of the subducting plate. This flexure allows pre-existing melts at the top of the asthenosphere to interact with the lithosphere before being extracted to the surface. The controlling mechanism is similar to that observed off-shore Japan, where small volumes of alkaline magmas were released in a region of convex lithospheric flexure (Sato et al., 2018). (c, d) Paleogeography at 0.5 Ma corresponding to the onset of volcanic activity at Mount Etna. The first tholeiitic magmas at Mount Etna between 500 and 300 kyr are associated with the development of the Aeolian-Tindari-Letojanni (ATL) transtensional fault-System and Cefalù-Etna strike slip faults related to the differential subduction between the Hyblean Plateau stuck beneath Sicily, while the Ionian slab continues to rollback. The development of these fault systems promotes extraction of melts from the base of the lithosphere and controls their emission at the surface. The initial tholeiitic composition of Mount Etna lavas is explained by melt–peridotite interaction. (e, f) Current context at Mount Etna. GPS measurements show that ATL transtensional fault system accommodates the differential movement between south-west and north-east parts of Sicily (Mastrolembo Ventura et al., 2014). This extension, and the progressive formation of dunite conduits by focused melt flow allows the rapid extraction of low degree asthenospheric melts accumulated by plate flexure (Naif et al., 2013). This mechanism provides an explanation for the increasing volumes of alkaline magma observed at Etna since 60 kyrs. Tectonic constraints are from Dewey et al. (1989), Argnani (2009), Mastrolembo Ventura et al. (2014), Barreca et al. (2020), and references therein. Arrows in panel (e) show the relative average horizontal velocity of tectonic plates around Sicily with respect to the Eurasian plate (Mastrolembo Ventura et al., 2014).

22
17

Fig. 2. Seafloor expression of the NFZ in northern Cascadia.

Map of seafloor scarps associated with active Nootka Fault Zone (NFZ) deformation. Color shading represents the gradient of seafloor bathymetry calculated from an azimuth of 300° clockwise from north using the Global Multi Resolution Topography version 4 grid (89). The scarps of the Northern Nootka Fault (NNF) and Southern Nootka Fault (SNF) have an average trend of ~N28°E. H, Haggis Mound; M, Maquinna Mound. Note that the NFZ is wider in the SW and narrows toward the deformation front in the NE.

Fig. 9. Slab fragmentation and cessation of subduction enabled by the NFZ.

Schematic 3D interpretation of the NFZ-Exp-JdF triple junction region in northern Cascadia where subduction termination is imminent. The paleo-NFZ (thin black lines) developed as a broad shear zone in nascent oceanic lithosphere and reactivated inherited abyssal hill faults formed at the ridge. The weakened lithosphere buckled as a trench-parallel slab tear formed at the northern edge of the Exp slab and migrated across the paleo-NFZ wake. Recent strain localization along the modern NFZ at ~1 Ma dissected the migrating slab tear and effectively isolated the Exp microplate, leading to enhanced tearing, decoupling, and a local reduction in the slab pull force. The NFZ thus serves as a trench-normal segmentation boundary enabling piecewise slab fragmentation and subduction termination.

23
12
24
9
submitted 3 weeks ago* (last edited 3 weeks ago) by supersquirrel@sopuli.xyz to c/earthscience@mander.xyz

for reference from https://en.wikipedia.org/wiki/Earth%27s_inner_core

Recent geophysical studies show that Yellowstone’s shallow magma reservoirs are replenished by melts from the asthenosphere. Both seismic and magnetotelluric images reveal that the Yellowstone caldera complex and magma reservoirs are connected by a southwest-dipping plumbing network that extends to the uppermost asthenosphere beneath the eastern Snake River Plain, where hot asthenosphere partially melts. This tilted translithospheric magma plumbing system (TLMPS) is a robust feature of different observational studies, but its geodynamic origin remains unknown.

To identify the driving mechanism of Yellowstone’s tilted TLMPS and the origin of melts, we constructed a comprehensive three-dimensional geodynamic model using geophysically and geodynamically constrained present-day structures of the convective mantle and the continental lithosphere. In this model, we simultaneously calculated the present-day dynamics of the lithosphere and the convective mantle in a unified physical framework.

Our results show that Yellowstone’s tilted TLMPS is primarily controlled by lithospheric tectonics. Below Yellowstone, our model predicts a southwest-dipping extension zone, jointly shaped by the lithospheric body force due to lithospheric density structure and basal traction caused by eastward-flowing hot asthenosphere interacting with the lithosphere. This tilted translithospheric deforming zone closely resembles the geophysically imaged TLMPS beneath Yellowstone, confirming the key role of tectonic extension in tapping melts from the uppermost asthenosphere and bringing them to the surface.

Cartoon showing Yellowstone’s present-day translithospheric magma plumbing system (TLMPS).

The blue region in the lithosphere, representing the tectonic extensional region, generally outlines the TLMPS in the Yellowstone region. In the asthenosphere beneath Yellowstone, eastward-flowing hot material produces primary melts with little input from the mantle plume. After penetrating into the lithosphere, primary melts migrate into the tilted TLMPS and ultimately fuel Yellowstone’s surface volcanism. LAB, lithosphere-asthenosphere boundary.

for reference from https://en.wikipedia.org/wiki/Mantle_plume

The above graphic from wikipedia illustrates how most geologists formerly believed volcanic activity at Yellowstone arose, a modern example can be seen in the Hawaiian Island Chain. This new research proposes an alternate view of Yellowstone.

25
24
view more: next ›

Earth, Environment, and Geosciences

3720 readers
13 users here now

Welcome to c/EarthScience @ Mander.xyz!


Notice Board

This is a work in progress, please don't mind the mess.


What is geoscience?

Geoscience (also called Earth Science) is the study of Earth. Geoscience includes so much more than rocks and volcanoes, it studies the processes that form and shape Earth's surface, the natural resources we use, and how water and ecosystems are interconnected. Geoscience uses tools and techniques from other science fields as well, such as chemistry, physics, biology, and math! Read more...

Quick Facts

Rules

  1. Don't throw mud. Be kind and remember the human.
  2. Keep it rooted (on topic).
  3. No spam.


Jobs

Teaching Resources

Tools

Climate


Similar Communities


Sister Communities

Science and Research

Biology and Life Sciences

Plants & Gardening

Physical Sciences

Humanities and Social Sciences

Memes

founded 2 years ago
MODERATORS