view the rest of the comments
Selfhosted
A place to share alternatives to popular online services that can be self-hosted without giving up privacy or locking you into a service you don't control.
Rules:
-
Be civil: we're here to support and learn from one another. Insults won't be tolerated. Flame wars are frowned upon.
-
No spam posting.
-
Posts have to be centered around self-hosting. There are other communities for discussing hardware or home computing. If it's not obvious why your post topic revolves around selfhosting, please include details to make it clear.
-
Don't duplicate the full text of your blog or github here. Just post the link for folks to click.
-
Submission headline should match the article title (don’t cherry-pick information from the title to fit your agenda).
-
No trolling.
Resources:
- selfh.st Newsletter and index of selfhosted software and apps
- awesome-selfhosted software
- awesome-sysadmin resources
- Self-Hosted Podcast from Jupiter Broadcasting
Any issues on the community? Report it using the report flag.
Questions? DM the mods!


I don't see a clear indication that you have too low RAM... RAM should be "used" fully at all times and your "cached" RAM value suggest you still have quite a bunch of RAM that could potentially be consumed by applications when they need it.
I cannot clearly see a swap usage in the graphs - that would be an interesting value to judge the overall stability of the system with regards to fluctuating RAM usage.
However, once you notice the problem again, right after you manage to log in, run a "dmesg -T | grep -i oom" and see if any processes get killed due to temporarily spiking RAM consumption. If you're lucky that command might lend some insight even now still.
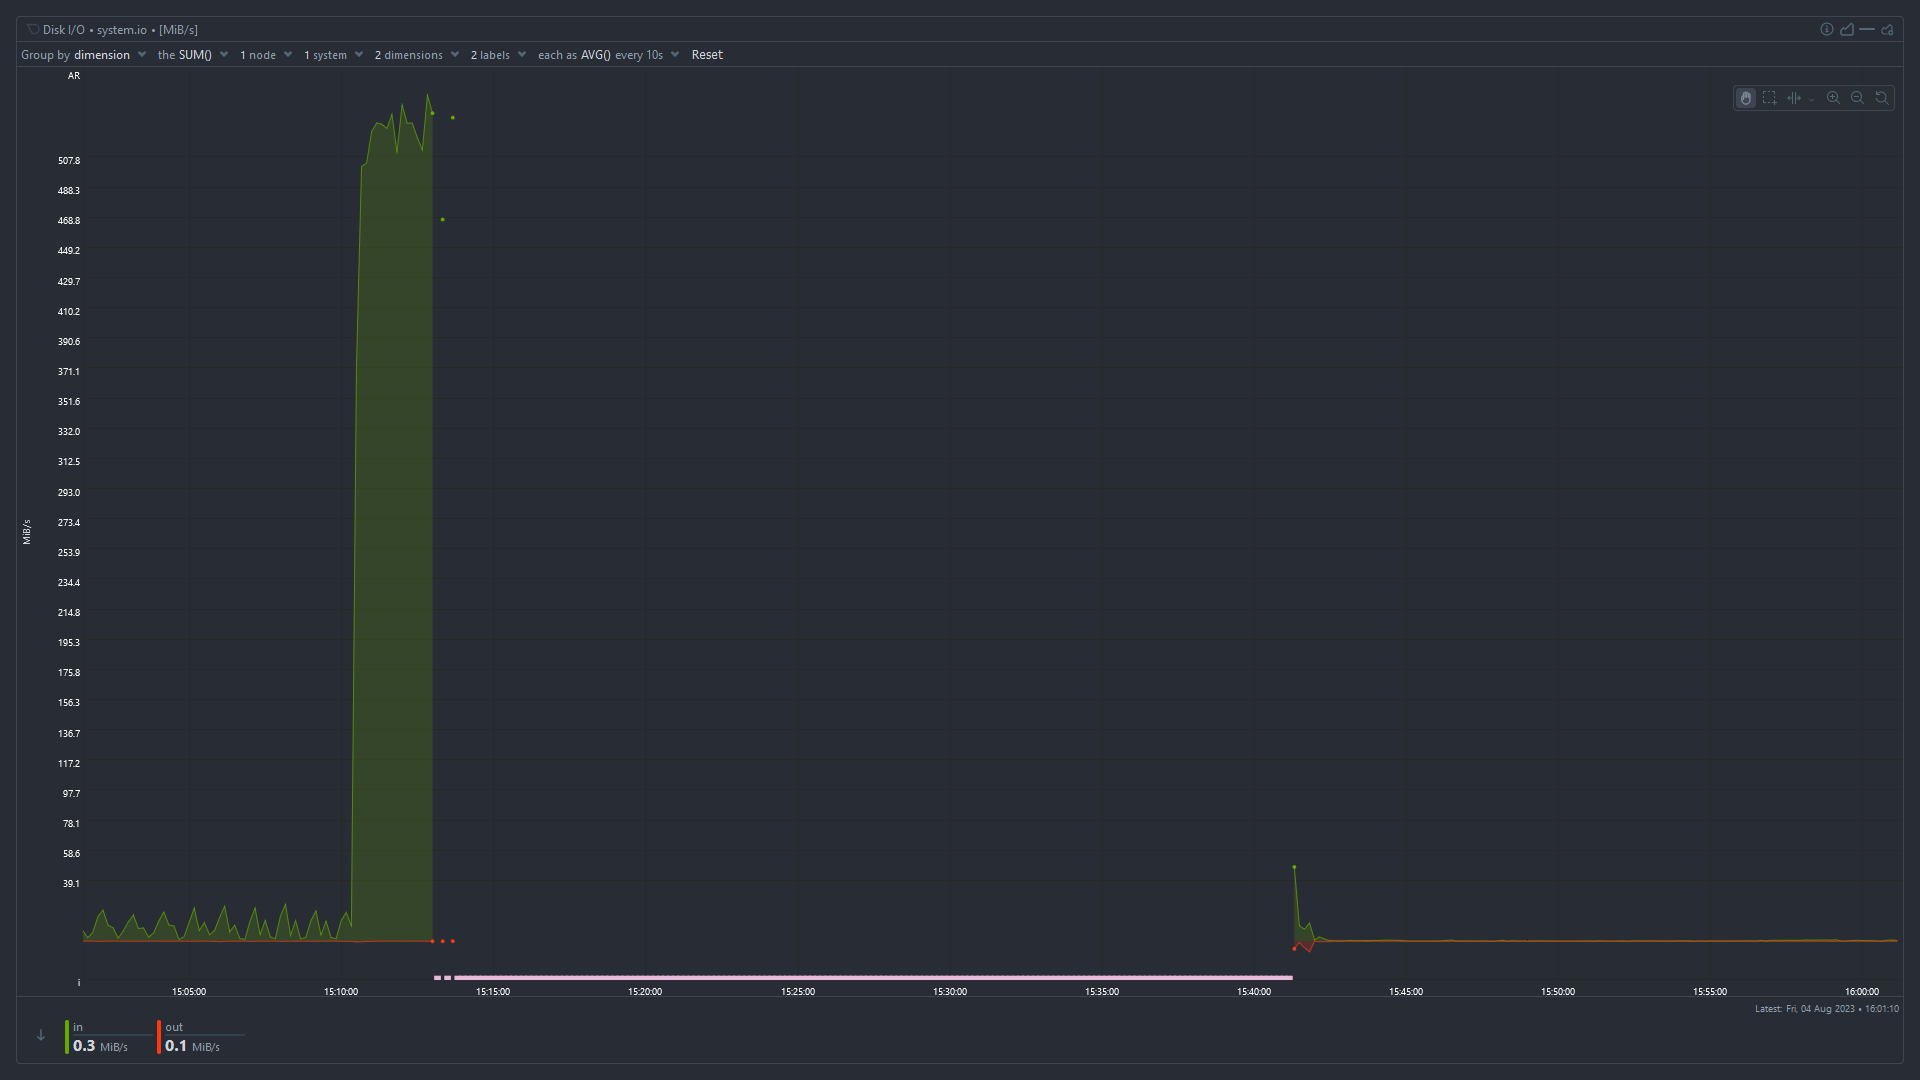
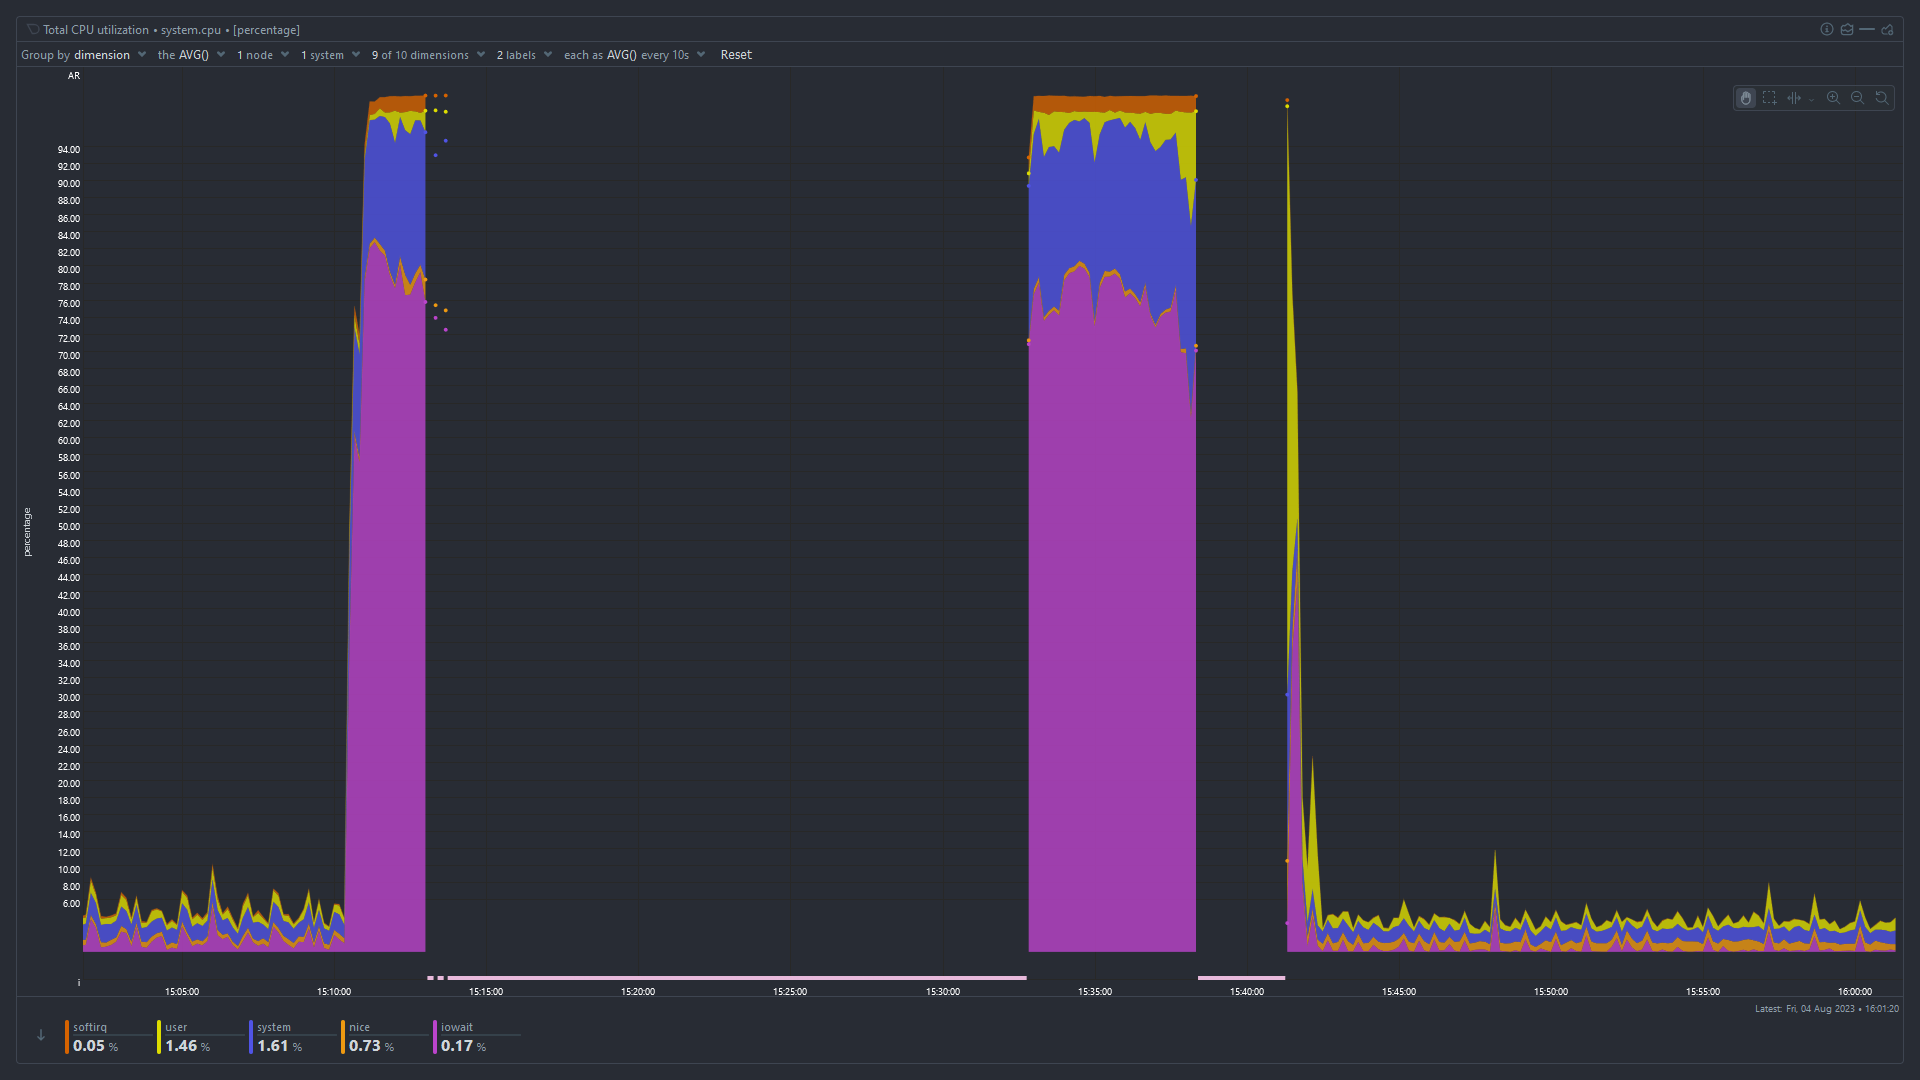
Also, what if you run a "top" command for a while, what's the value for "wa" in the second line like? "wa" stands for I/O wait and if that value is anything above 5 it might indicate that your CPU is being bottlenecked by for instance hard disk speed.
Before it was rebooted the "cached" value (blue) was very small and decreasing. It goes back to normal after a reboot. I think tmpfs is included in "cached" as well, so it may be effectively zero.
You're right - I missed that detail. From the graphs alone it looks as if a process ate up all still free to claim (cached) memory, then the system stalled possibly thrashing until OOM kill intervened - as indicated by large chunks of RAM being freed. Allocated RAM in red lowering and cached RAM in blue rising again.