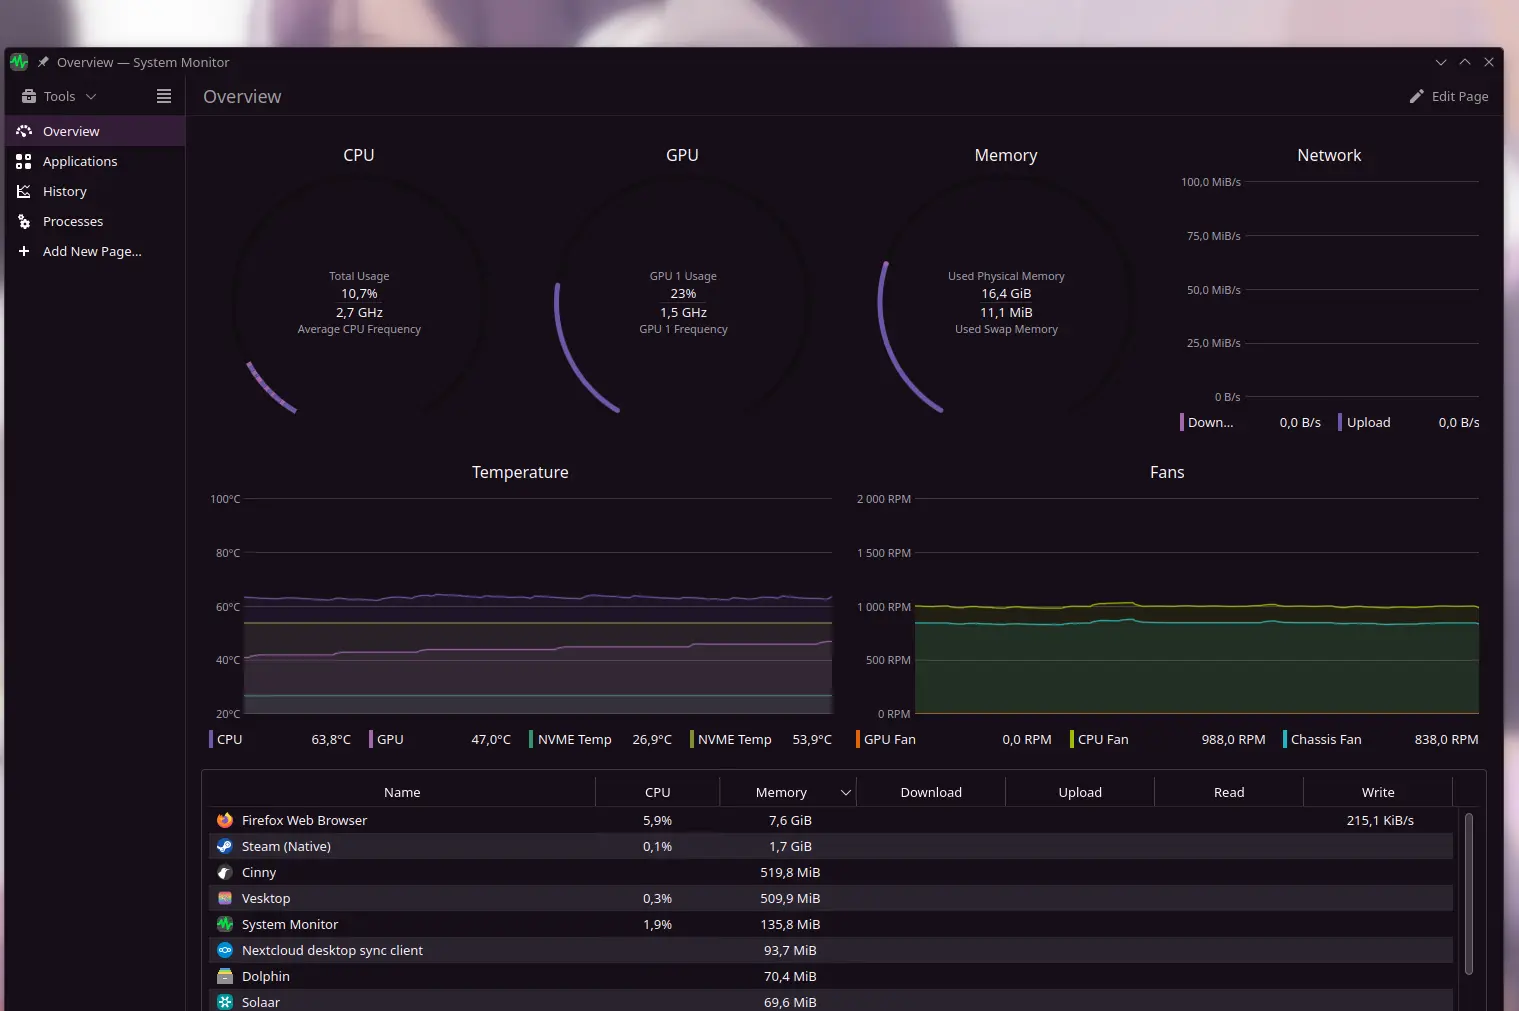
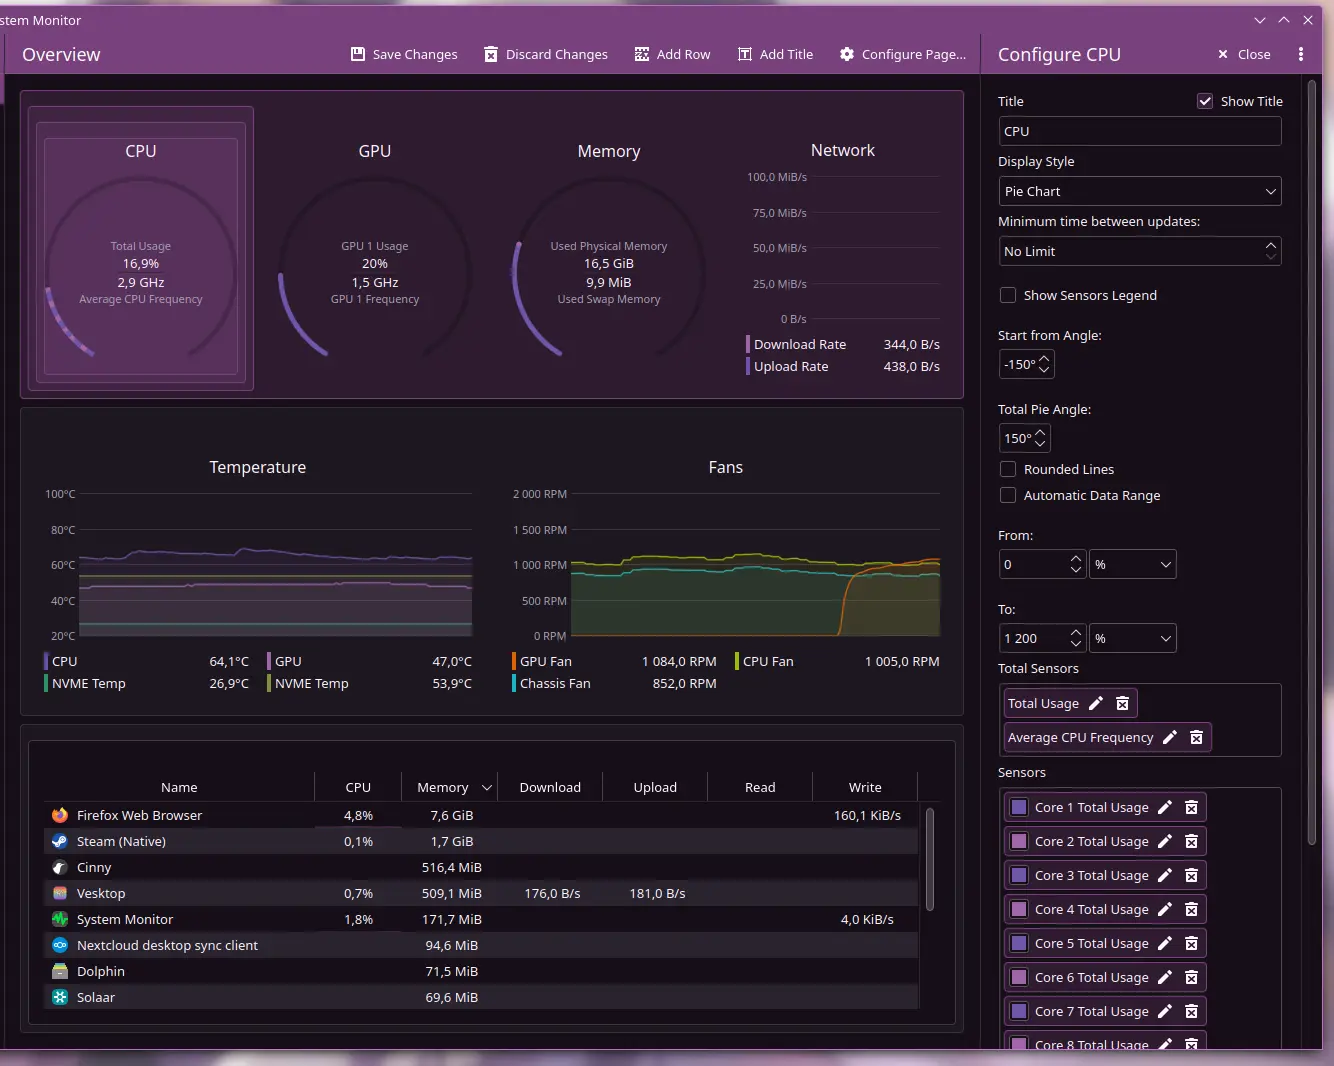
The default system monitor application that comes with KDE can do this. You will need to click the "edit page" button in the top right, and create a custom layout that shows all the sensors you want. Here is mine:


You can display the data using pie charts, text, line charts, etc.
Once you create your layout, you can even turn it into a widget that you can have on your desktop or drop into your taskbar.
