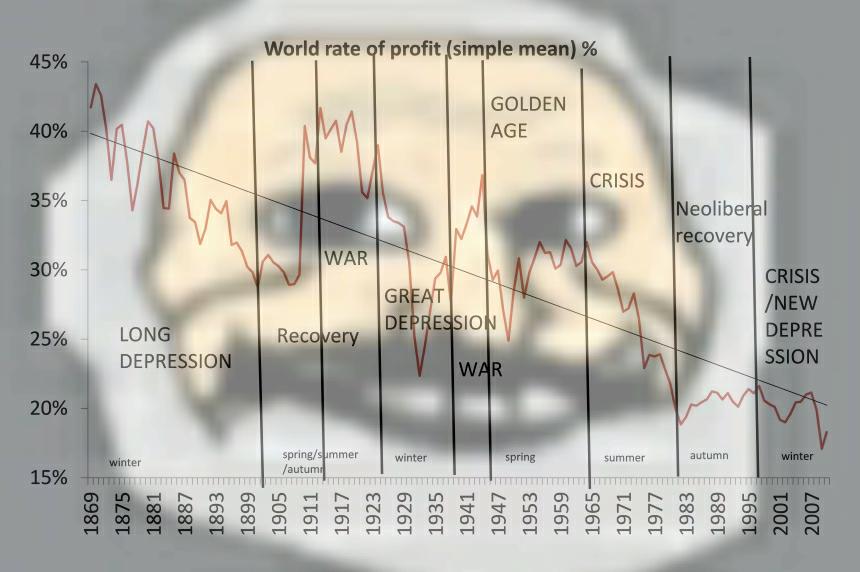
I love this graph, it is an excellent graph

I love this graph, it is an excellent graph

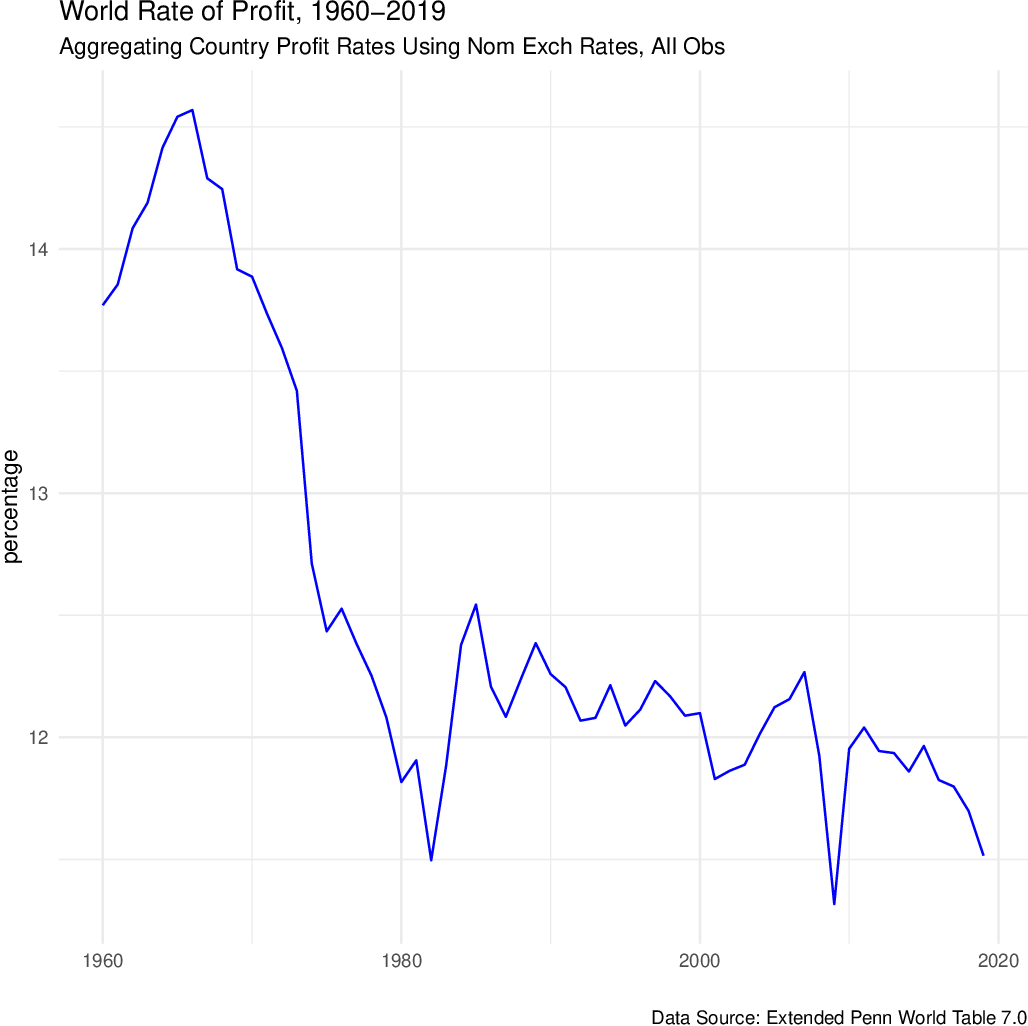
1960 - 2020 chart, it's the most up to date one I've seen.

Link?
This comes from this data: https://www.rug.nl/ggdc/productivity/pwt/?lang=en
This specific chart comes from page 29 of this, which uses the above data: https://scholarworks.umass.edu/server/api/core/bitstreams/69ff54a4-6554-48b9-9b5b-58008cb25725/content
Ayo not starting at zero >:(
Completely fine as long as the axes are clearly marked and consistently spaced
True, but a measure of uncertainty would be nice to see as well. Anything anti-capitalist will be held to a higher standard so we should be in the habit of including errorbars, for example.
I would suggest that anyone interested in this subject read "The failure of capitalist production", by Andrew Kliman. The author delves into the tendency for the rate of profit to fall in marxist terms, looking especially, but not exclusively, at the 2008 crisis.
I mention this because he uses an analogy that made me understand the tendency for the rate of profit to fall more accurately: like gravity, the rate of profit tends to fall, but that does not mean that all objects on Earth will eventually reach their lowest point with no means of going back up. It is merely a tendency, which capitalism is always fighting back against, and not a deterministic prediction about an absolute low in the rate of profits in the future.
Good meme tho
Just need to make "Falling Rate of Profit" bigger
Never seen this, GOATed comrade
HEXMARX !!!

Dear god, that line's not doing what it's supposed to at all
Banned? DM Wmill to appeal.
No anti-nautilism posts. See: Eco-fascism Primer
Slop posts go in c/slop. Don't post low-hanging fruit here.