20
Imagine how bad it would be if Americans didn't have guns to defend themselves.
Imagine how bad it would be if Americans didn't have guns to defend themselves.
Louisianians be like "Chicago tho amirite"
"We've tried nothing and we're all out of ideas!"
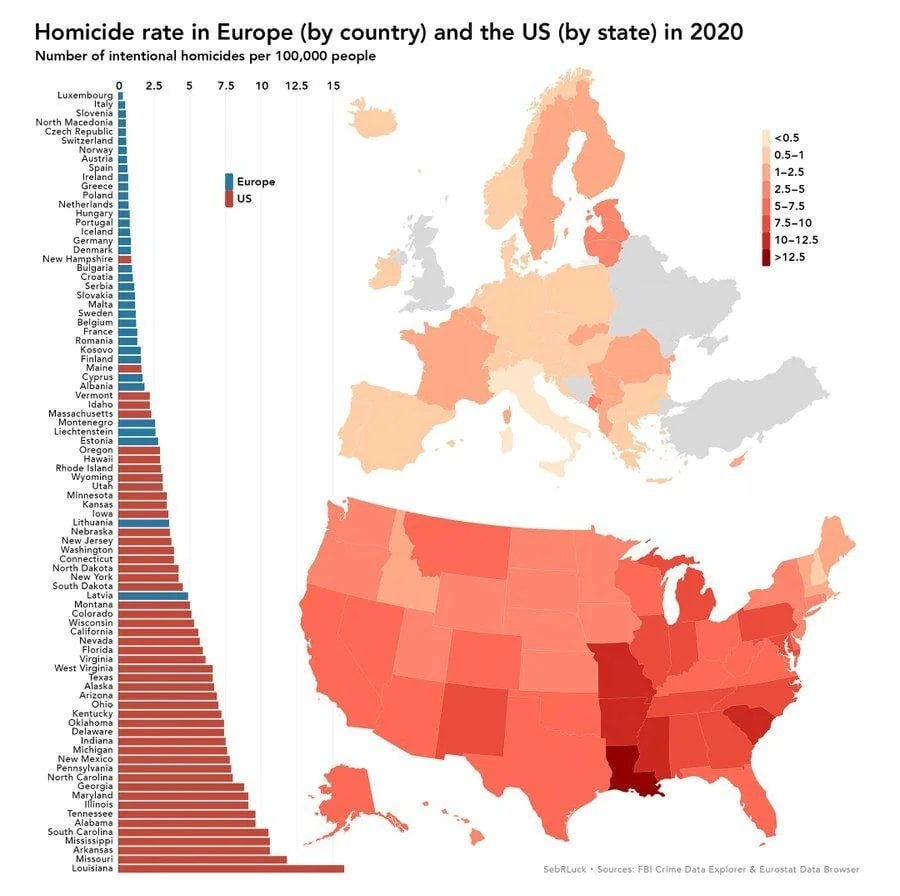
Why do these European charts omit the UK?
We left the EU, not the bloody continent.
We are on there but we had no killings. Just tragic accidents for the greater good.
The data is provided by Eurostat. An EU organisation, they are not going to fund numbers for a country not in the EU anymore (some other countries might still join for various reasons.)
If they hold that stance, the graph should not use 'Europe' when they essentially mean 'EU member nations', especially if they omit the UK for the reasons you state as the UK is a part of Europe.
Edit: not sure how difficult this is to understand. Europe is a continent, which includes the UK. The chart says Europe, not EU, whilst omitting a country within Europe.
I feel for you. I understand what you're saying. Unfortunately I only have one up vote to counter everyone else.
Switzerland and Norway are not part of the EU either.
In this case it is the graph makers laziness to not find extra stats on the UK. On the other part I believe the UK has the choice to join again, especially on side project as Eurostat. If a European country doesn't want to join on European initiatives then I'm bit sure if we should treat them specially. The choice is theirs and it was clearly made.
What's the reason for excluding so many european countries in this graphic?
The UK not being included makes me think that these are only EU member countries? I don't know for sure though.
Switzerland is included though. I'm thinking it's just data availability.
It literally says Eurostat in the bottom right
Eurostat (European Statistical Office; DG ESTAT) is a Directorate-General of the European Commission (...). Eurostat's main responsibilities are to provide statistical information to the institutions of the European Union (EU) and to promote the harmonisation of statistical methods across its member states and candidates for accession as well as EFTA countries.
so many
Two countries are being left out. Is two a high number to you?
UK, Switserland, Russia, Belarus, Ukraine, Moldavia.
Cyprus is included for some reason.
Which two of the above were you referring to?
The numbers for Russia and Ukraine would be quite bad at the moment, me thinks.
Isn't the aim of the game to make US look bad?
The US does look bad. There is no make involved. The US homocide / gun deaths numbers are en par to some failed states or those with civil or actual war.
Pretty sure the UK is no longer part of Europe. The greyed out countries aren't part of Europe, so why would they be included?
The UK is part of Europe, it just isn't part of the EU.
I mean, they would certainly like to be again.
Not sure about that. The 51% who voted against membership still voted for the trainwreck of Tory leaderships.
They won't admit that it was a fuck up, because collapsing an economy, killing workers rights, and plunging more people into poverty than the past 30 years is fair game when you're a racist.
Out-dated British imperial ideals. For some reason a sizable portion of the UK believes they're the most important country in the world because of... Legacy?
Except that legacy has made a lot of bad blood around the world, and the rest of Europe was kind of happy to see the UK go, because the UK always wanted an exceptional place in e edy decision and deal with the EU.
So many things you've said have been so wrong so far.
You completely misunderstand what happen, what is happening, and other peoples reactions.
You should stick with your poorly thought out American politics.
I'm European. But yes, do please tell me how I "misunderstood" things, and not simply made an observation about the sheer arrogance and hubris of the UK, as one of your neighbours.
i'ld say thats not really a surprise IF you have a system that helps criminals to thrive while it tries hard to always put innocent to jail instead and prevent real investigations for the truth, thats at least how i see it.
Below are some links to related "last week tonight"s from YT.
Plz tell me if thats just a show full of lies or if that terror is real in poor underdeveloped 3rd world US: (i might have linked videos not too bad, but i think i was horrified by the outcomes of those linked)
Prosecutors https://m.youtube.com/watch?v=ET_b78GSBUs
Wrongful convictions https://m.youtube.com/watch?v=kpYYdCzTpps
Migrant crime https://m.youtube.com/watch?v=axsgzg3RyF0
Crime Reporting https://m.youtube.com/watch?v=kCOnGjvYKI0
School police https://m.youtube.com/watch?v=KgwqQGvYt0g
Police interrogations https://m.youtube.com/watch?v=obCNQ0xksZ4
death investogations https://m.youtube.com/watch?v=hnoMsftQPY8
forensic science https://m.youtube.com/watch?v=ScmJvmzDcG0
update: fixed broken link, added titles
Im a bit suprised where New Hampshire is on the list. They are the little texas of new england and you can not tell anyone from that state what to do.
Damn, Latvia
USA is such a great country
What's the deal with Louisiana?
outside of NO, the region is reletively low on education, poverty ridden and low opportunity. its the trio that makes high homicide rate.
What's up in the baltic?
Really? wildly waves hands at history
You gotta be extremely ignorant of even basic history to not see why.
Maybe you're right. I know very little about the history of the baltics, it never came up even once at school. Also news coverage about it is lackluster at best.
Do you have any specific events/timeperiods I should look into?
What’s up with New Hampshire that it’s on par with the EU countries?
Authright (PCM) has an answer but I won't repeat it here
Why not? Are you some sorta coward? I'll say it: yeah, fascists think a whiter population leads to reduced crime rates. That's because fascists are rubes and imbeciles with such a stunted worldview that they're incapable of considering the effects of any other socio-economic factors such as education, distribution of wealth, etc.
A place to share and discuss visual representations of data: Graphs, charts, maps, etc.
DataIsBeautiful is for visualizations that effectively convey information. Aesthetics are an important part of information visualization, but pretty pictures are not the sole aim of this subreddit.
A place to share and discuss visual representations of data: Graphs, charts, maps, etc.
  A post must be (or contain) a qualifying data visualization.

  Directly link to the original source article of the visualization
    Original source article doesn't mean the original source image. Link to the full page of the source article as a link-type submission.
    If you made the visualization yourself, tag it as [OC]

  [OC] posts must state the data source(s) and tool(s) used in the first top-level comment on their submission.

  DO NOT claim "[OC]" for diagrams that are not yours.

  All diagrams must have at least one computer generated element.

  No reposts of popular posts within 1 month.

  Post titles must describe the data plainly without using sensationalized headlines. Clickbait posts will be removed.

  Posts involving American Politics, or contentious topics in American media, are permissible only on Thursdays (ET).

  Posts involving Personal Data are permissible only on Mondays (ET).
Please read through our FAQ if you are new to posting on DataIsBeautiful. Commenting Rules
Don't be intentionally rude, ever.

Comments should be constructive and related to the visual presented. Special attention is given to root-level comments.

Short comments and low effort replies are automatically removed.

Hate Speech and dogwhistling are not tolerated and will result in an immediate ban.

Personal attacks and rabble-rousing will be removed.

Moderators reserve discretion when issuing bans for inappropriate comments. Bans are also subject to you forfeiting all of your comments in this community.
Originally r/DataisBeautiful